Overlapping line graph areas fight for foreground layer on mouse movement
Open
difficulty: easy
discussion-required
en
enhancement
pending
- Dominant language
- TypeScript
- Stars
- 67.3k
- Forks
- 19.8k
- Avg merge
- 11d 14h
- Merged PRs (30d)
- 8
Description
### Version
5.0.2
### Steps to reproduce
1. Draw overlapping line graphs.
2. Move mouse over overlapping area.
### What is expected?
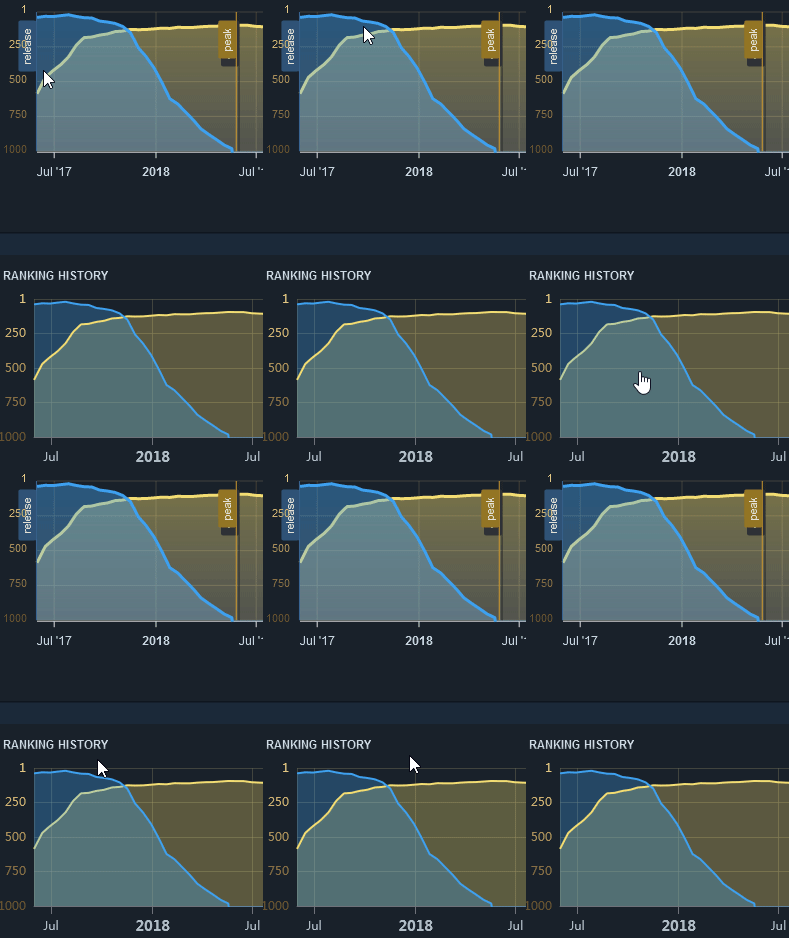
Chart should display consistently, with one line in front of the other, that does not change.
### What is actually happening?
As mouse moves over the overlapping area, lines swap foreground/background layers in a pseudo-random fashion, as they fight for the foreground layer.
* **Top example** is from different charting software.
* **Bottom example** is ECharts 5.0.2.
Contributor guide
Assessment
This issue has not been assessed yet.