Connected charts become disconnected when data points outside axis range
Open
bug
en
- Dominant language
- TypeScript
- Stars
- 67.3k
- Forks
- 19.8k
- Avg merge
- 11d 14h
- Merged PRs (30d)
- 8
Description
### Version
5.1.0
### Steps to reproduce
1. Create chart with visible data points.
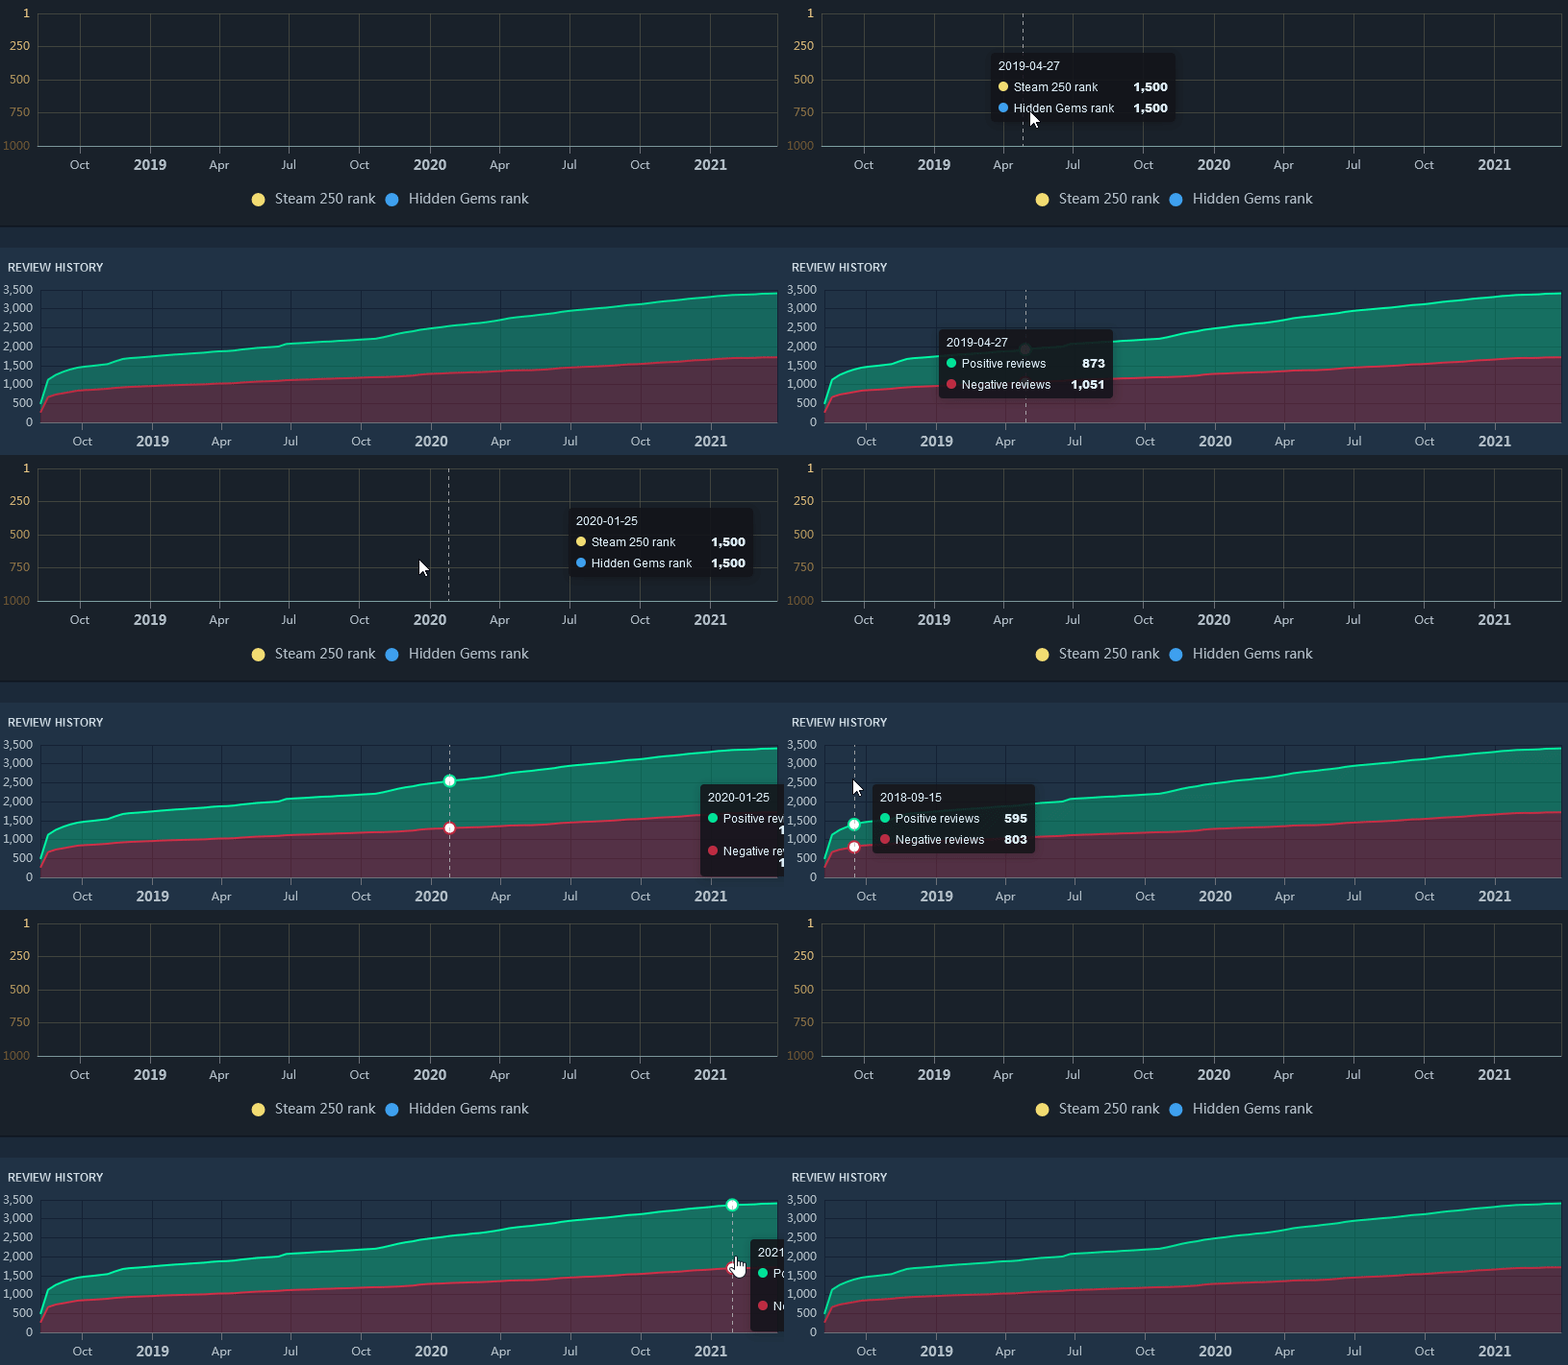
2. Create connected chart with data points below the axis range (not drawn on chart).
### What is expected?
Charts should always be bidirectionally connected.
### What is actually happening?
Charts become unidirectionally connected if paired chart's data points are outside the axis range.
Contributor guide
Assessment
This issue has not been assessed yet.