LineChart with Datazoom: Data is displayed incorrectly
- Dominant language
- TypeScript
- Stars
- 67.3k
- Forks
- 19.8k
- Avg merge
- 11d 14h
- Merged PRs (30d)
- 8
Description
### Version
5.0.1
### Reproduction link
[https://echarts.apache.org/examples/en/editor.html?c=line-aqi](https://echarts.apache.org/examples/en/editor.html?c=line-aqi)
### Steps to reproduce
Add the following datazoom option to the example:
```js
{
show: true,
type: 'slider',
orient: 'vertical'
}
```
Move the lower limit of the y axis range in the datazoom slider to something around 100.
### What is expected?
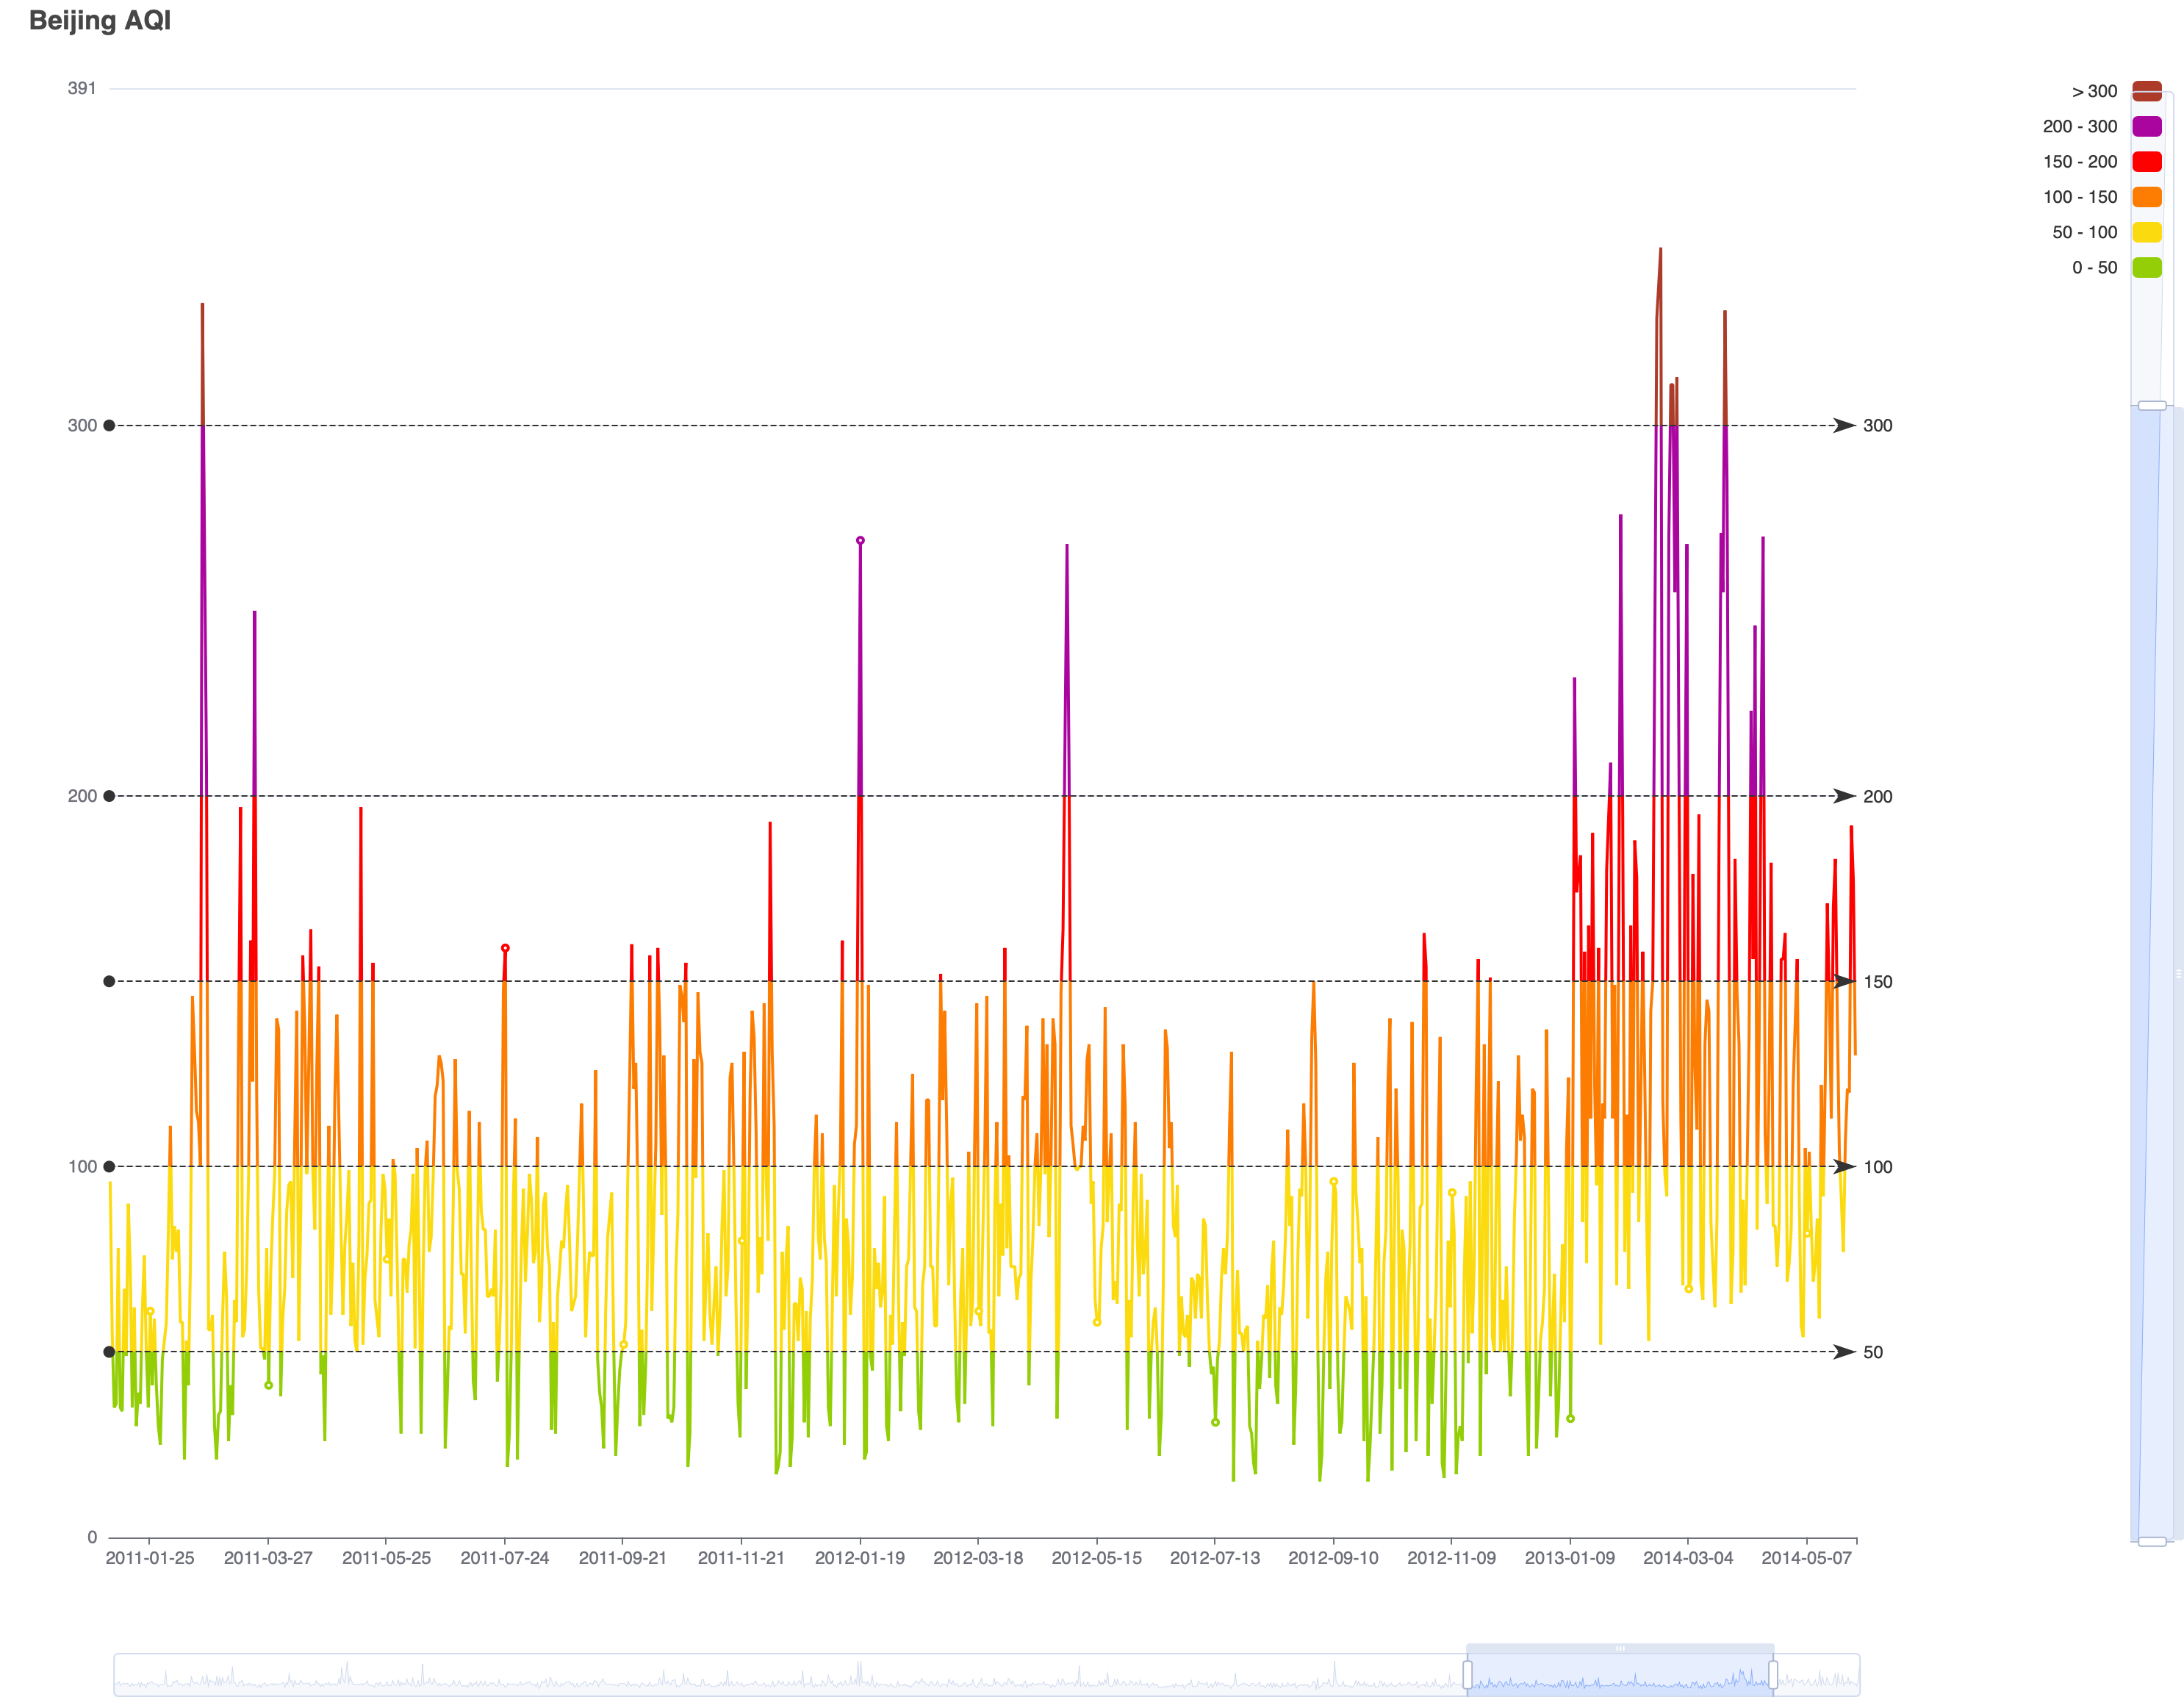
The data should still be displayed correctly. That is, the lines should partially disappear from view, but the qualitative data history must be maintained.
### What is actually happening?
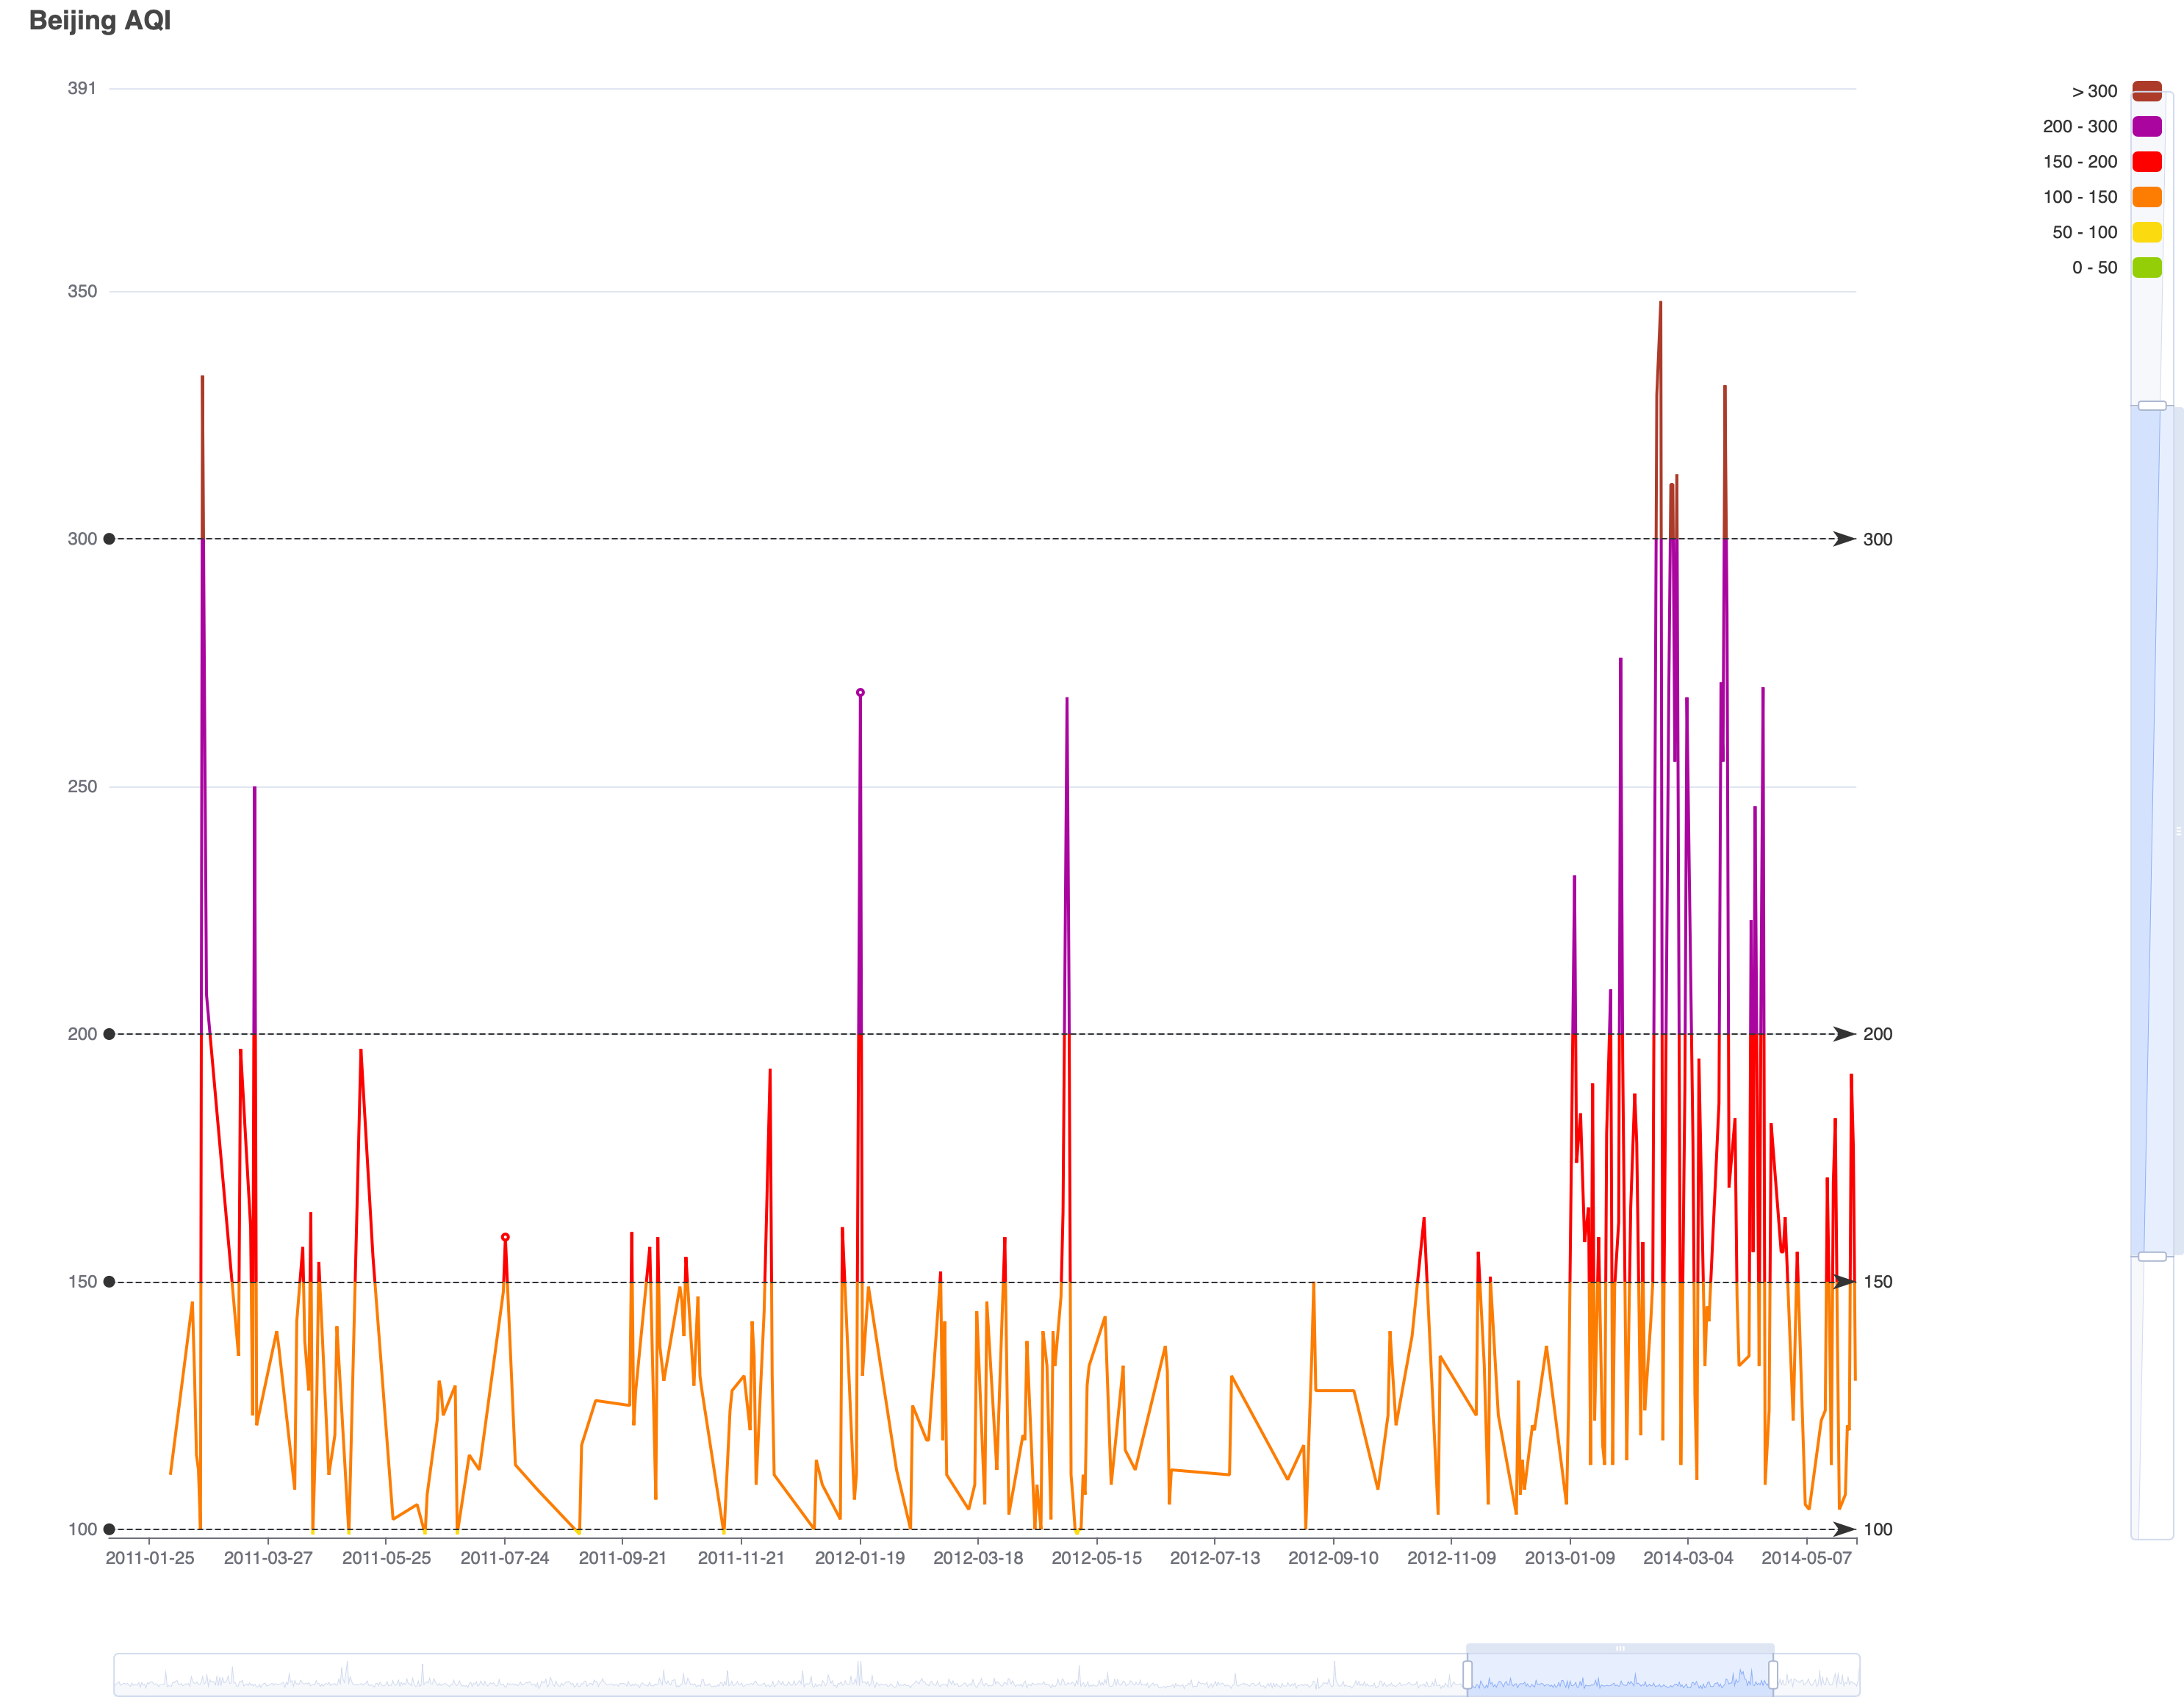
The qualitative history of the data is not maintained. Instead the last point before the data is leaving the displayed range and the first point after entering the displayed range again are connected by a line in the visible chart excerpt. That changes the qualitative data history completely.
Contributor guide
Assessment
This issue has not been assessed yet.