Support for Dendrogram Diagram
- Dominant language
- TypeScript
- Stars
- 67.3k
- Forks
- 19.8k
- Avg merge
- 11d 14h
- Merged PRs (30d)
- 8
Description
### What problem does this feature solve?
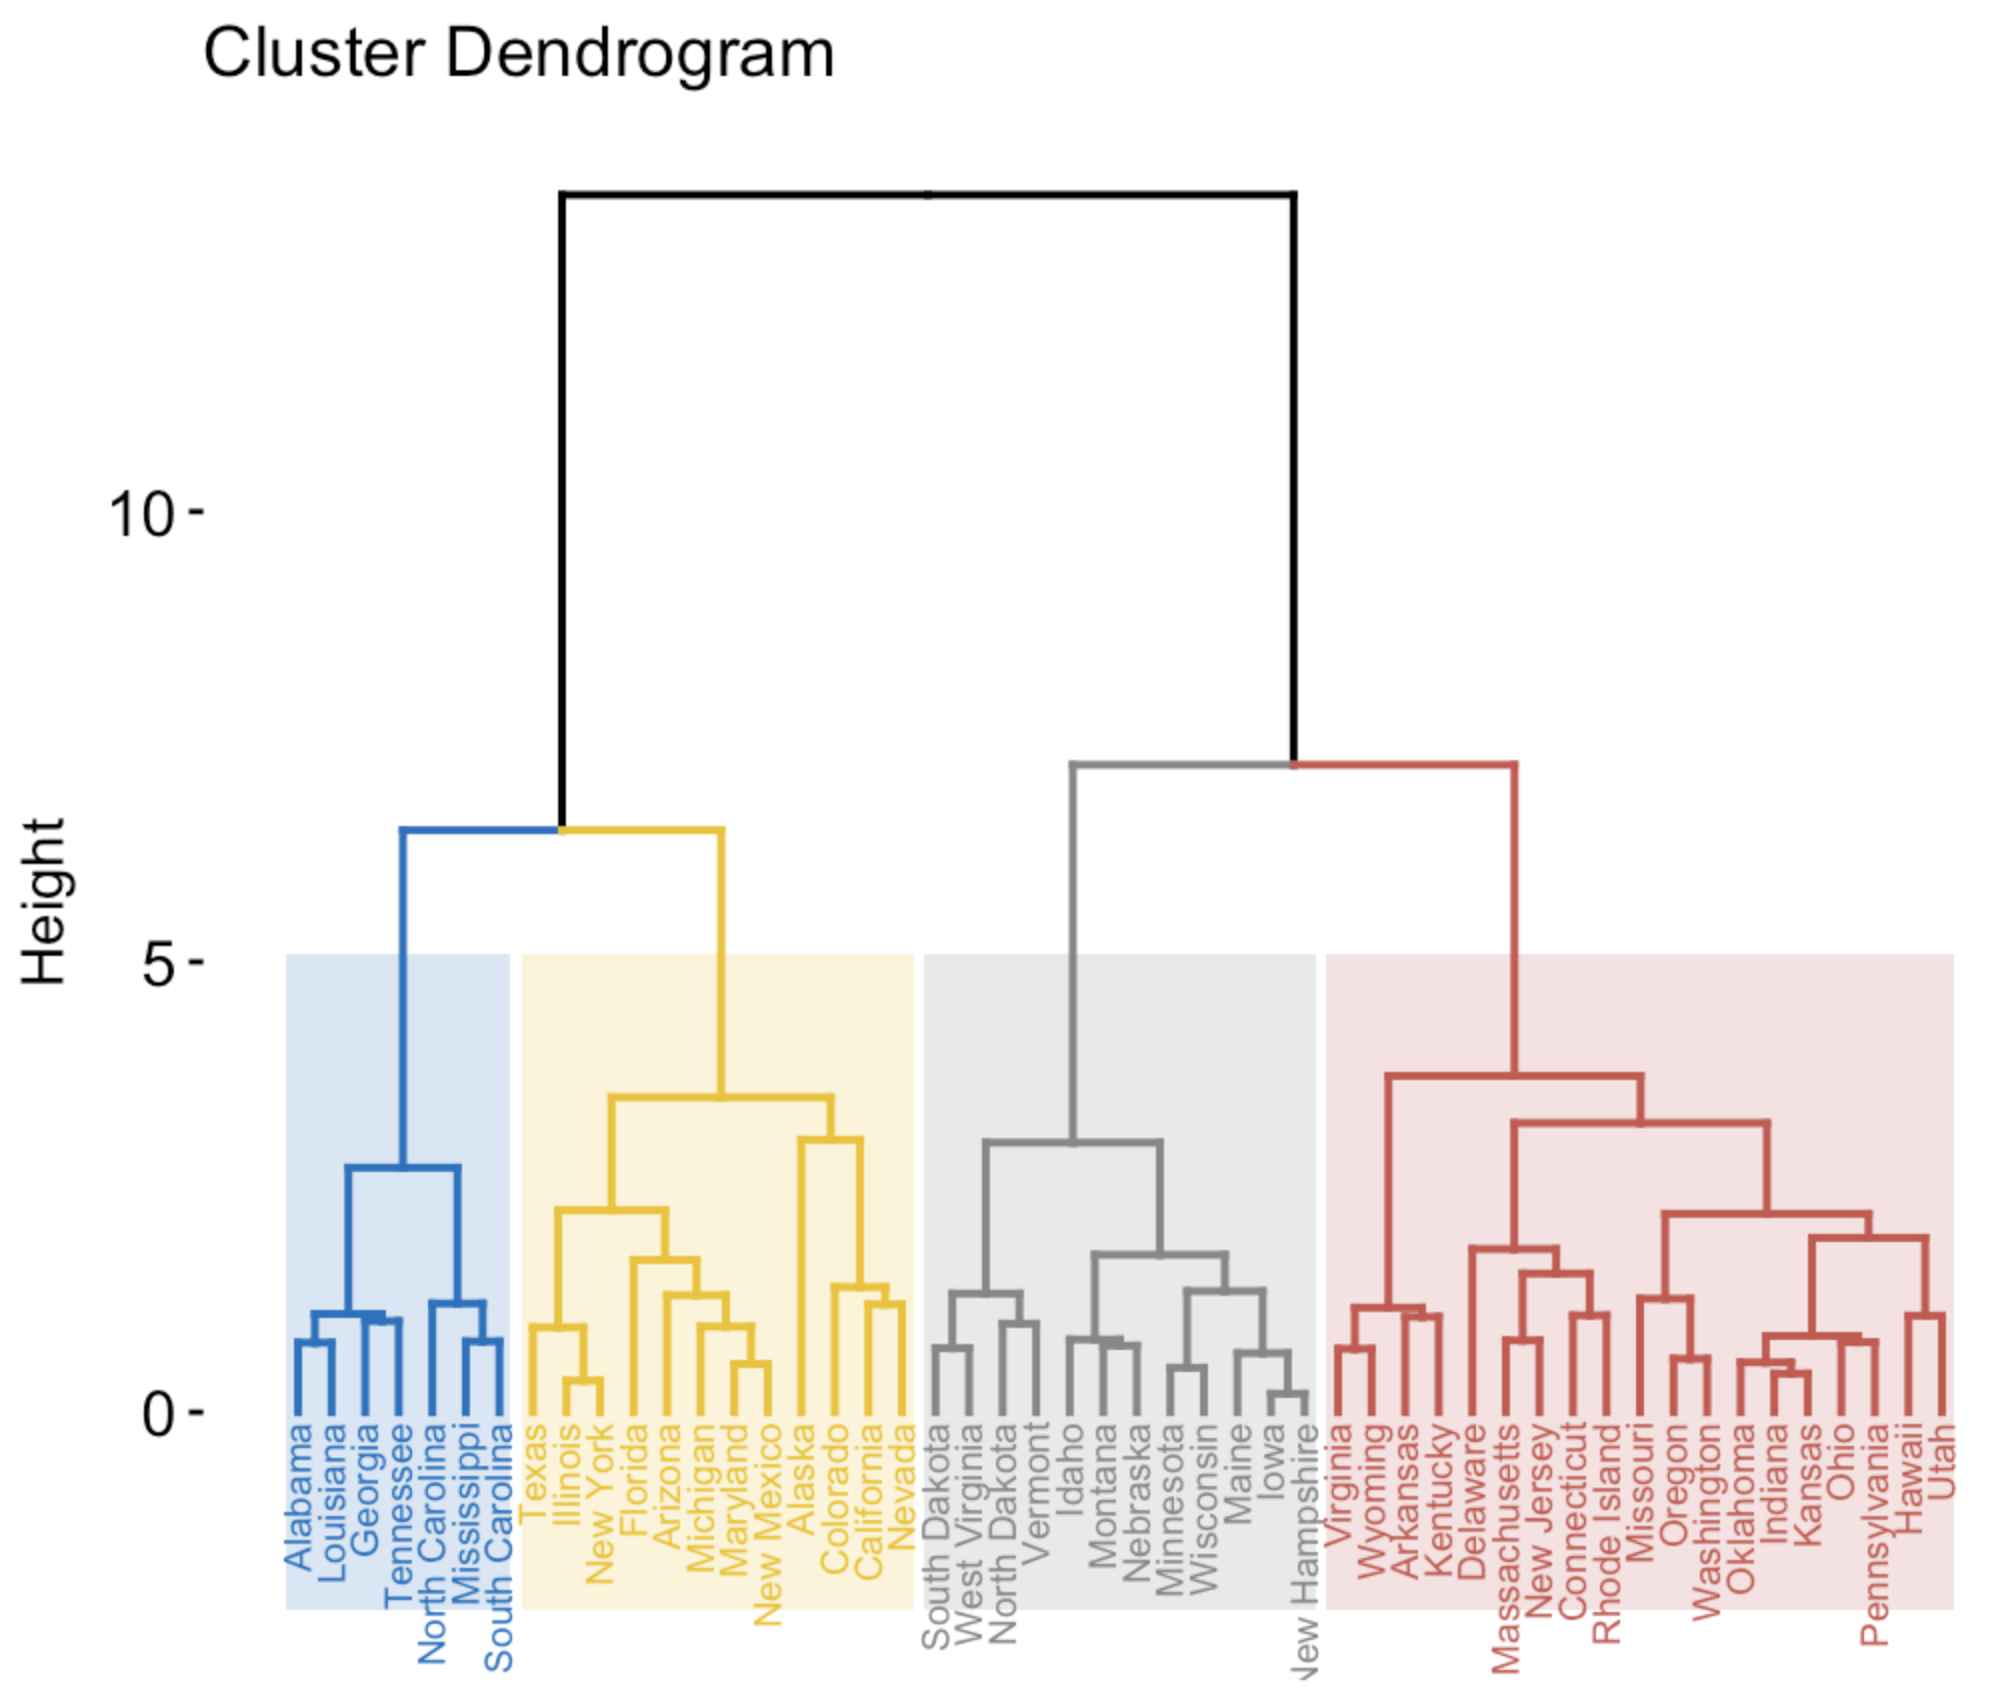
A dendrogram is a diagram that shows the hierarchical relationship between objects. It is most commonly created as an output from hierarchical clustering. The main use of a dendrogram is to work out the best way to allocate objects to clusters.
In our organization we have many use cases where we need to cluster objects/data into hierarchical diagram. Which I am not able find a way to achieve using existing charts in ECharts.
Please let us know in case we can create/extend Dendrograms by customizing ECharts.
### What does the proposed API look like?
A special chart type for 'dendrograms'
type: 'dendrogram',
Contributor guide
Assessment
This issue has not been assessed yet.