visualMap折线区间段颜色混淆
Open
bug
pending
- Dominant language
- TypeScript
- Stars
- 67.3k
- Forks
- 19.8k
- Avg merge
- 11d 14h
- Merged PRs (30d)
- 8
Description
### Version
4.7.0
### Steps to reproduce
```
visualMap:{
show:false,
dimension: 1,
pieces: [
{gte:-10,lte:0,color:'#8bc34a'},
{gt:0,lte:20,color:'#ff5722'},
]
},
```
### What is expected?
在值为大于-10小于等于0的区间,折线应该显示为绿色
### What is actually happening?
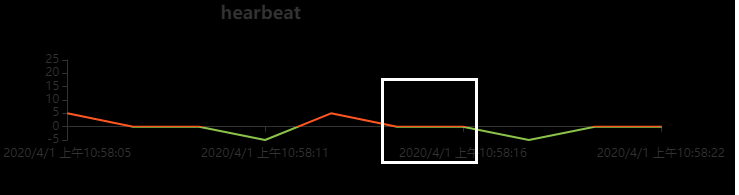
实际上在值为0时折线颜色是红色和绿色重叠混合的色值
使用{value: 0,color:'#8bc34a'}指定特定值的颜色也不起效
Contributor guide
Assessment
This issue has not been assessed yet.