apache / apache/echarts-examples
echarts如何绘制泰勒曲线?
Open
- Dominant language
- TypeScript
- Stars
- 399
- Forks
- 250
- Avg merge
- 2d 13h
- Merged PRs (30d)
- 5
Description
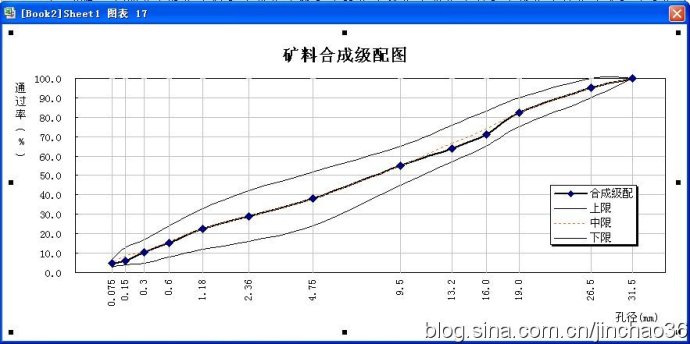
类似于这样,能自定义XV轴显示的值,同时根据值保持间距。
Contributor guide
No contributing guide indexed for this repository
Research direction
No file, test, or entry point is named. First clarify how the Taylor curve should be represented in ECharts, including custom X/Y-axis values and value-based spacing; done should be demonstrated by a working example matching the requested chart.
Written by the indexing model from the issue text.
Assessment
- Tech stack
- typescript
- Domain
- data-visualization
- Issue type
- Feature
- Difficulty
- 5/5
- Estimated time
- Over a week
- Activity status
- Stale
- Clarity
- Needs clarification
- Newbie friendliness
- 20/100