Compaction metrics are not being emitted correctly
- Dominant language
- Java
- Stars
- 14.1k
- Forks
- 3.8k
- Avg merge
- 2d 58m
- Merged PRs (30d)
- 233
Description
### Affected Version
Apache Druid v0.22.1.
### Description
Hey Druids!
I'm currently using Apache Druid 0.22.1 deployed on Kubernetes (v1.18) using [druid-operator](https://github.com/druid-io/druid-operator).
Aiming to create Grafana dashboards over auto-compaction behavior, I have selected the following metrics [from the docs](https://druid.apache.org/docs/latest/operations/metrics.html#coordination):
- `compact/task/count`
- `compactTask/availableSlot/count`
After setting auto-compaction on my data sources and configuring [prometheus-emitter](https://druid.apache.org/docs/latest/development/extensions-contrib/prometheus.html) extension I was able to capture metrics about ingestion, memory and others, but those referring to compaction tasks (listed above) were always returning the value `0`.
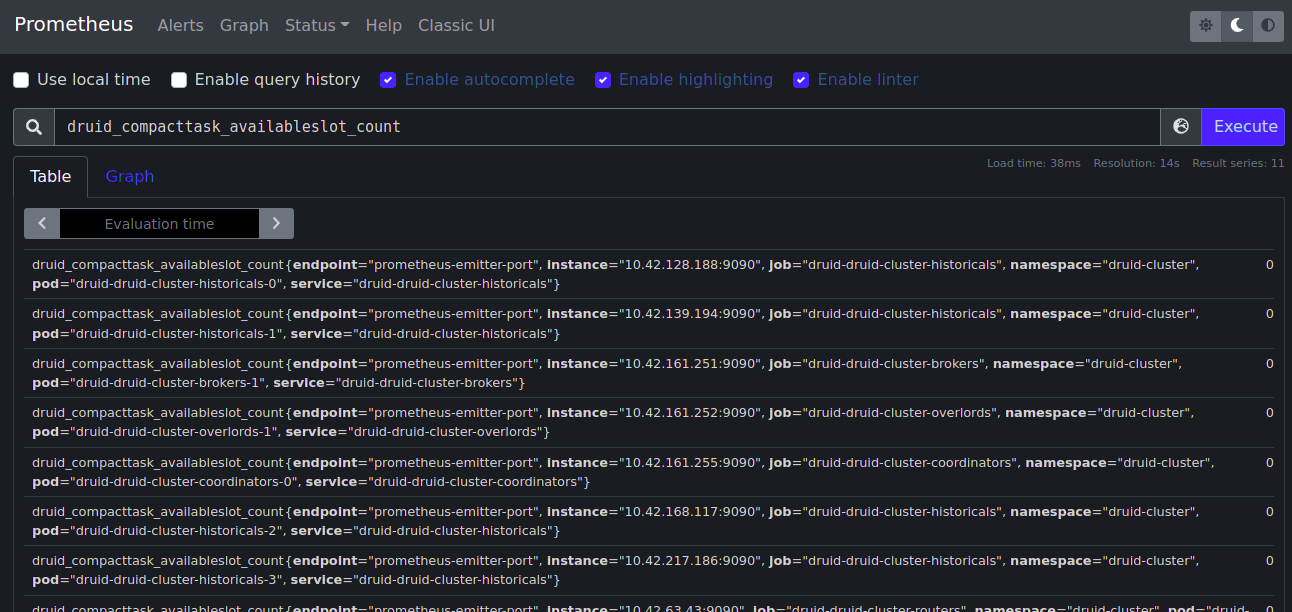
The following print screen shows this strange behavior for `compactTask/availableSlot/count`. The same occurs for `compact/task/count` even when there are compaction tasks running.
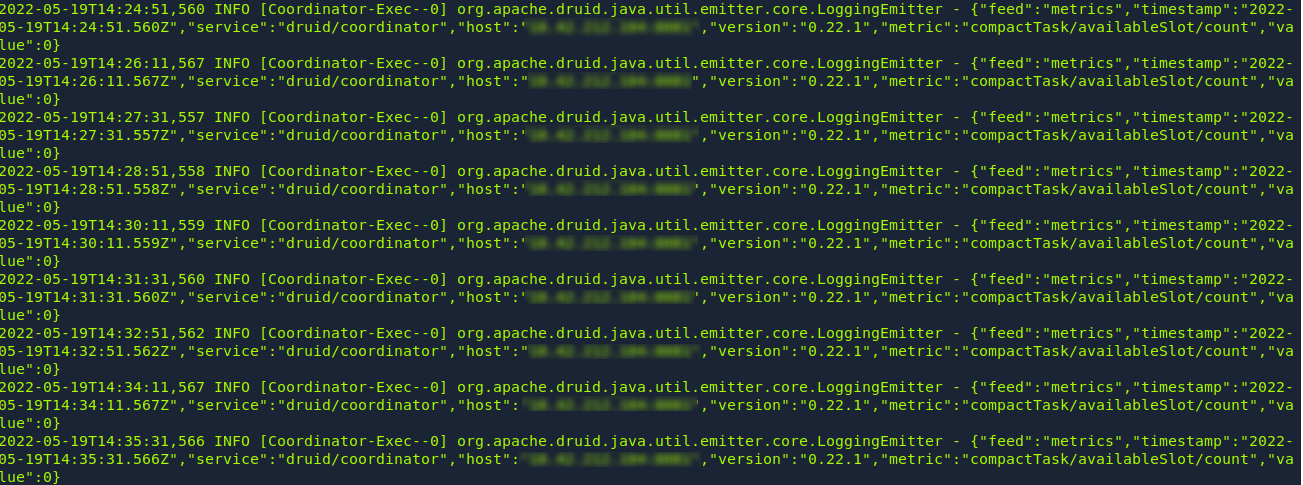
To isolate the problem I have set `druid.emitter=logging`, but the same situation was found (logs from coordinator):
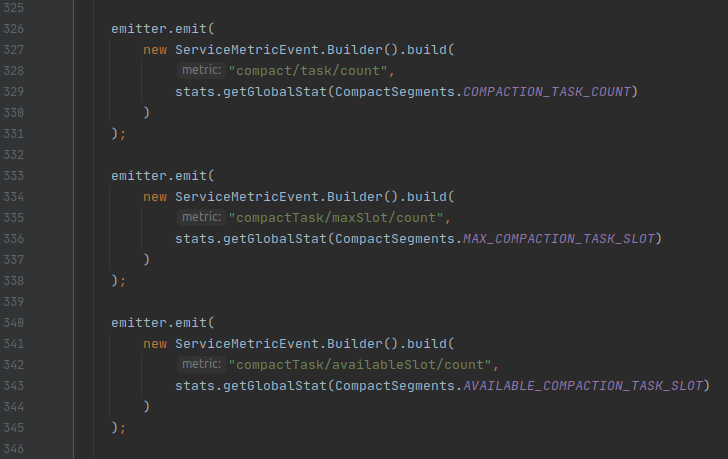
Taking a quick glance at the code I found out where those compaction metrics are included at coordinator status (at `src/main/java/org/apache/druid/server/coordinator/duty/CompactSegments.java`):

Later, those variables are emitted by a `ServiceEmitter` (at `src/main/java/org/apache/druid/server/coordinator/duty/EmitClusterStatsAndMetrics.java`):
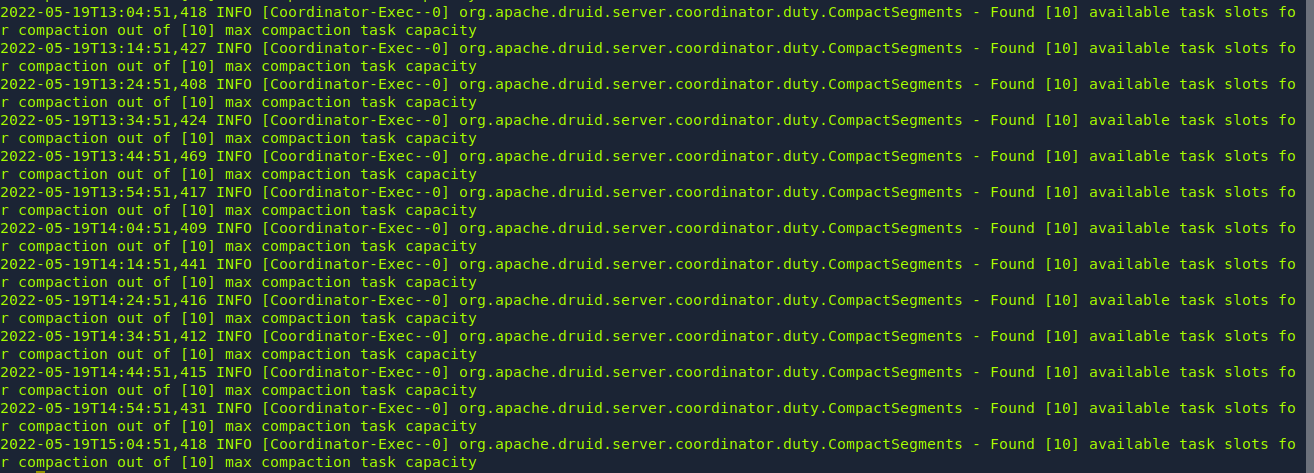
Grepping the log right above the `globalStat` at `CompactSegments.java` I could get the value set for `numAvailableCompactionTaskSlots` and `compactionTaskCapacity` variables (logs from coordinator):
**Given this scenario, am I missing some configuration or this version is running into a race condition at coordinator's duties?**
### Appendix
Leaving some additional info here to help debugging.
#### 1. Auto-compaction config
The auto-compaction config submitted to coordinators:
```json
{
"dataSource": "TEST",
"taskPriority": 25,
"inputSegmentSizeBytes": 524288000,
"maxRowsPerSegment": null,
"skipOffsetFromLatest": "P1D",
"tuningConfig": {
"maxRowsInMemory": null,
"maxBytesInMemory": null,
"maxTotalRows": null,
"splitHintSpec": null,
"partitionsSpec": {
"type": "single_dim",
"targetRowsPerSegment": 5000000,
"maxRowsPerSegment": null,
"partitionDimension": "nice_dimension",
"assumeGrouped": false
},
"indexSpec": null,
"indexSpecForIntermediatePersists": null,
"maxPendingPersists": null,
"pushTimeout": null,
"segmentWriteOutMediumFactory": null,
"maxNumConcurrentSubTasks": 2,
"maxRetry": null,
"taskStatusCheckPeriodMs": null,
"chatHandlerTimeout": null,
"chatHandlerNumRetries": null,
"maxNumSegmentsToMerge": null,
"totalNumMergeTasks": 1,
"forceGuaranteedRollup": true,
"type": "index_parallel"
},
"granularitySpec": null,
"ioConfig": null,
"taskContext": null
}
```
#### 2. Compaction config returned by the coordinator
Using route `/druid/coordinator/v1/config/compaction`, the coordinators have returned the following `maxCompactionSlots`:
```json
{
"compactionConfigs": [
{
"dataSource": "TEST",
...
}
],
"compactionTaskSlotRatio": 0.5,
"maxCompactionTaskSlots": 10
}
```
Contributor guide
Research direction
Start by tracing compactionTaskCapacity and numAvailableCompactionTaskSlots in src/main/java/org/apache/druid/server/coordinator/duty/CompactSegments.java, then follow their emission in src/main/java/org/apache/druid/server/coordinator/duty/EmitClusterStatsAndMetrics.java. Reproduce the zero values with the provided auto-compaction configuration and logging or Prometheus emitter; done means explaining and correcting why running compaction tasks are reported as zero.
Written by the indexing model from the issue text.
Assessment
- Tech stack
- grafana, java, kubernetes, prometheus
- Domain
- backend, observability
- Issue type
- Bug
- Difficulty
- 4/5
- Estimated time
- 3-5 days
- Activity status
- Stale
- Clarity
- Mostly clear
- Newbie friendliness
- 35/100