apache / apache/datafusion-ballista
[EPIC] Improve Cluster Observability
- Dominant language
- Rust
- Stars
- 2.1k
- Forks
- 320
- Avg merge
- 1d 22h
- Merged PRs (30d)
- 66
Description
Two major directions (as of now):
## Collect Executor Statistics
As starting point we could start by collecting and aggregating executor statistic, something similar to [spark UI executor tab](https://spark.apache.org/docs/3.5.7/web-ui.html#executors-tab)
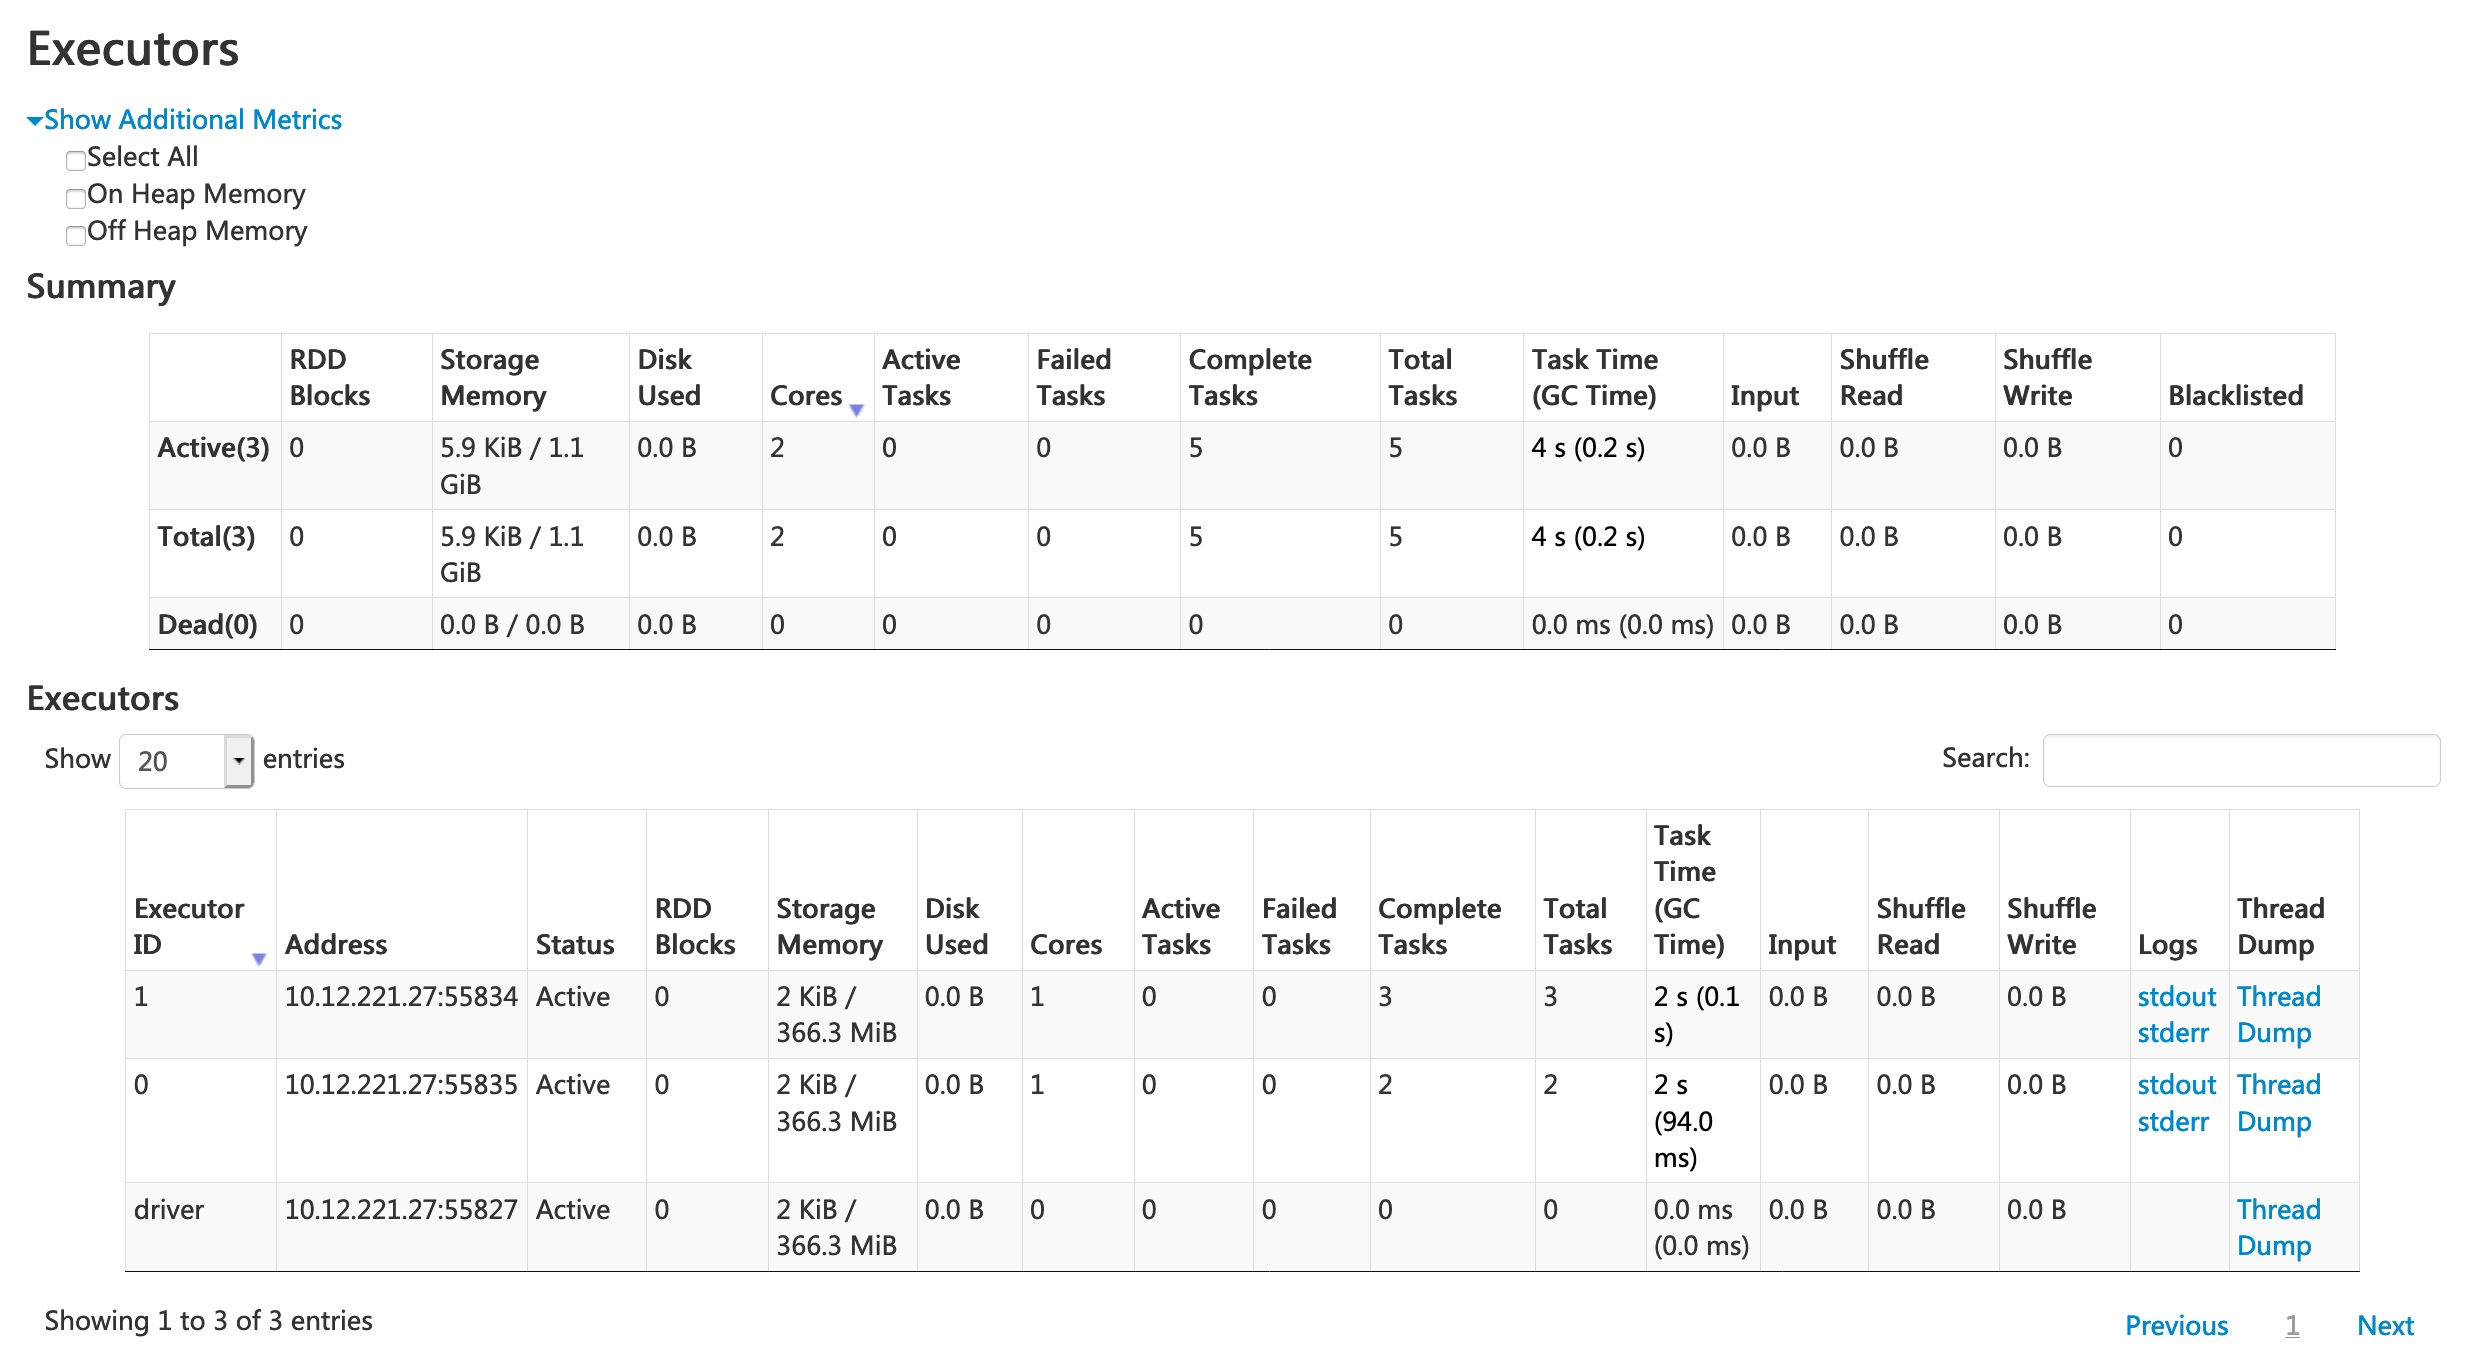
some statistics, such as memory utilisation, disk usage, would be collected on the executor, other like shuffle read and write may be collected on scheduler side.
We would need to expose additional rest interface to expose collected metrics
## Per Stage Flame Graph
Similar to [Nvidia RAPIDS Per Stage Flame Graph](https://nvidia.github.io/spark-rapids/docs/additional-functionality/per-stage-flamegraph.html) collect stats and produce flame graphs.
We would need to further investigate what should be done
## TODO:
- [x] https://github.com/apache/datafusion-ballista/pull/1547
- [ ] per stage flame graphs
Contributor guide
Research direction
Review the completed PR 1547 and the linked Spark UI and RAPIDS flame-graph references first; no source file or test is named in the issue. Clarify which remaining direction is in scope and define completion criteria for the statistics, REST exposure, or per-stage flame-graph work before implementation.
Written by the indexing model from the issue text.
Assessment
- Tech stack
- rust
- Domain
- distributed-systems, observability-sre
- Issue type
- Feature
- Difficulty
- 5/5
- Estimated time
- Over a week
- Activity status
- Quiet
- Clarity
- Needs clarification
- Newbie friendliness
- 25/100