cpu profiler显示的函数不完整
- Dominant language
- C++
- Stars
- 17.6k
- Forks
- 4.1k
- Avg merge
- 2d 12h
- Merged PRs (30d)
- 69
Description
**Describe the bug (描述bug)**
开启cpu profiler后部分线程的调用函数没有显示出来,每次都只有固定那几个线程显示
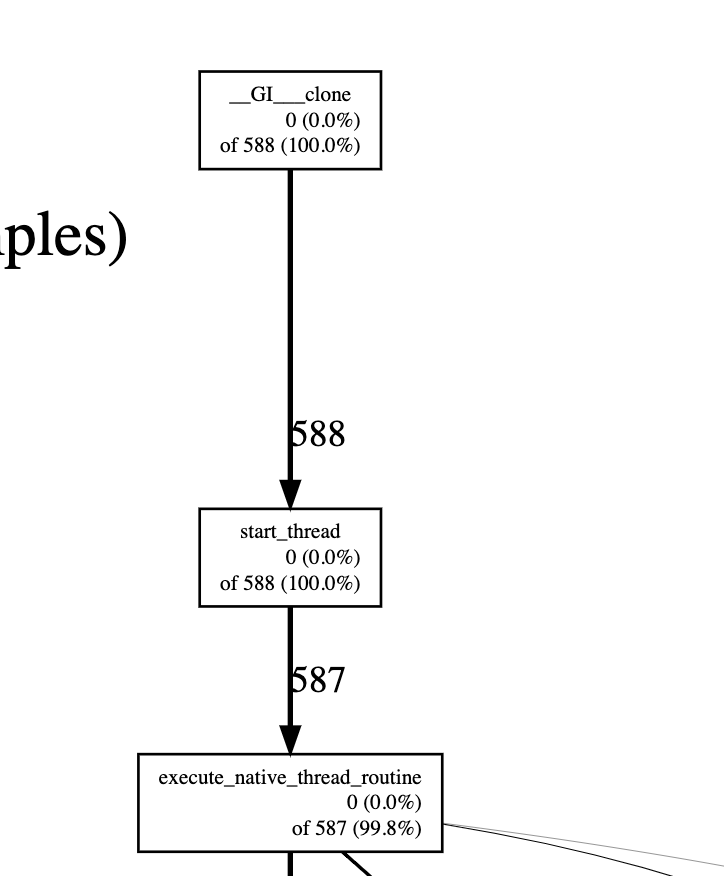
还有这个采样次数从上边588到下边587少了一次正常吗
**To Reproduce (复现方法)**
**Expected behavior (期望行为)**
cpu profiler显示所有函数调用
**Versions (各种版本)**
OS:Debian GNU/Linux 10 (buster)
Compiler:gcc 830
brpc:
protobuf:
**Additional context/screenshots (更多上下文/截图)**
Contributor guide
Research direction
No source files or tests are named. Start by reproducing the CPU profiler report on Debian 10 with the reported compiler, compare displayed threads, functions, and sample counts, then trace the profiler's sampling and reporting entry points. Done means the missing function calls are displayed or the sampling discrepancy is explained and covered by a regression test.
Written by the indexing model from the issue text.
Assessment
- Tech stack
- cpp, debian
- Domain
- performance
- Issue type
- Bug
- Difficulty
- 4/5
- Estimated time
- 3-5 days
- Activity status
- Stale
- Clarity
- Needs clarification
- Newbie friendliness
- 25/100