🥰 [FEATURE] Sunburst Sectors Filling
- Dominant language
- TypeScript
- Stars
- 2.7k
- Forks
- 591
- PR merge metrics
- No merged PRs in 30d
Description
### 🥰 Features description [Please make everyone to understand it]
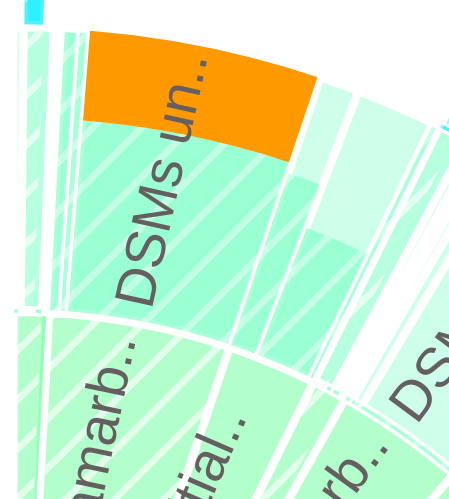
Add sectors filling, for example, displaying the completion of something. Each sector (child in data) will have Estimate and Fact value, which can be displayed on chart sector. Actualy, we can show oveflow too, if fact is grater than estimate.
### 🏞 What problem does this feature solve
This feature will allow us to show percentage complete of anything.
### 🧐 What does the proposed API look like
```
{
"label": "类别 1.1.1.1.1",
"children": null,
"uv": 1,
"estimate_sum": 1,
"fact_sum":0.5,
"count": 0
}
```
### 🚑 Any additional [like screenshots]
I made my version using additional D3-Hierarchy example with additional code. (I mentioned it in my old-old feature request https://github.com/antvis/G2Plot/issues/2493).
Here's a little example. Child has Estimate time and Work time (in task-tracking system, for context), Sunburst shows tasks effictivity, complition and overflow (orange filled subsector). Pattern's shows fill - with pattern is a fact, without is an estimate.
Contributor guide
Research direction
Review the proposed data shape and the linked D3-Hierarchy example, then compare them with the current Sunburst implementation in G2Plot. The work is done when child sectors can show estimate and fact completion, including overflow when fact exceeds estimate, with the requested visual distinction.
Written by the indexing model from the issue text.
Assessment
- Tech stack
- typescript
- Domain
- data-visualization
- Issue type
- Feature
- Difficulty
- 5/5
- Estimated time
- Over a week
- Activity status
- Stale
- Clarity
- Mostly clear
- Newbie friendliness
- 35/100