🥰 [FEATURE] Gauge support outline as guide line like Grafana
- Dominant language
- TypeScript
- Stars
- 2.7k
- Forks
- 591
- PR merge metrics
- No merged PRs in 30d
Description
### 🥰 Features description [Please make everyone to understand it]
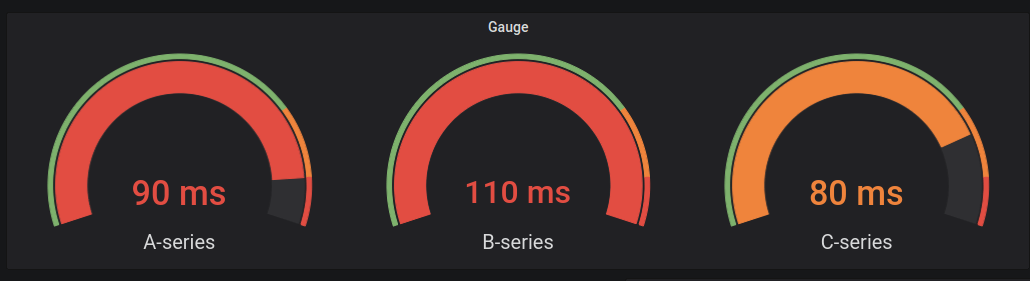
- Support to render outline as guide line.
### 🏞 What problem does this feature solve
- Use segmented and colored outline as guide line when no indicator and axis.
### 🧐 What does the proposed API look like
```js
outline: {
ticks: number[];
color: string | string[];
width: number;
style: StyleAttr;
}
```
### 🚑 Any additional [like screenshots]
- Grafana: https://play.grafana.org/d/vmie2cmWz/bar-gauge?orgId=1&refresh=10s

Contributor guide
Research direction
Start by locating the Gauge implementation and its existing outline, indicator, and axis rendering paths. Compare the requested ticks, color, width, and style API with the linked Grafana example. Done means Gauge can render segmented, colored outline guide lines when no indicator or axis is present, with the proposed API behavior covered by tests.
Written by the indexing model from the issue text.
Assessment
- Tech stack
- typescript
- Domain
- data-visualization
- Issue type
- Feature
- Difficulty
- 5/5
- Estimated time
- Over a week
- Activity status
- Stale
- Clarity
- Mostly clear
- Newbie friendliness
- 35/100