🥰 [FEATURE] 对称条形图支持分组
Open
- Dominant language
- TypeScript
- Stars
- 2.7k
- Forks
- 591
- PR merge metrics
- No merged PRs in 30d
Description
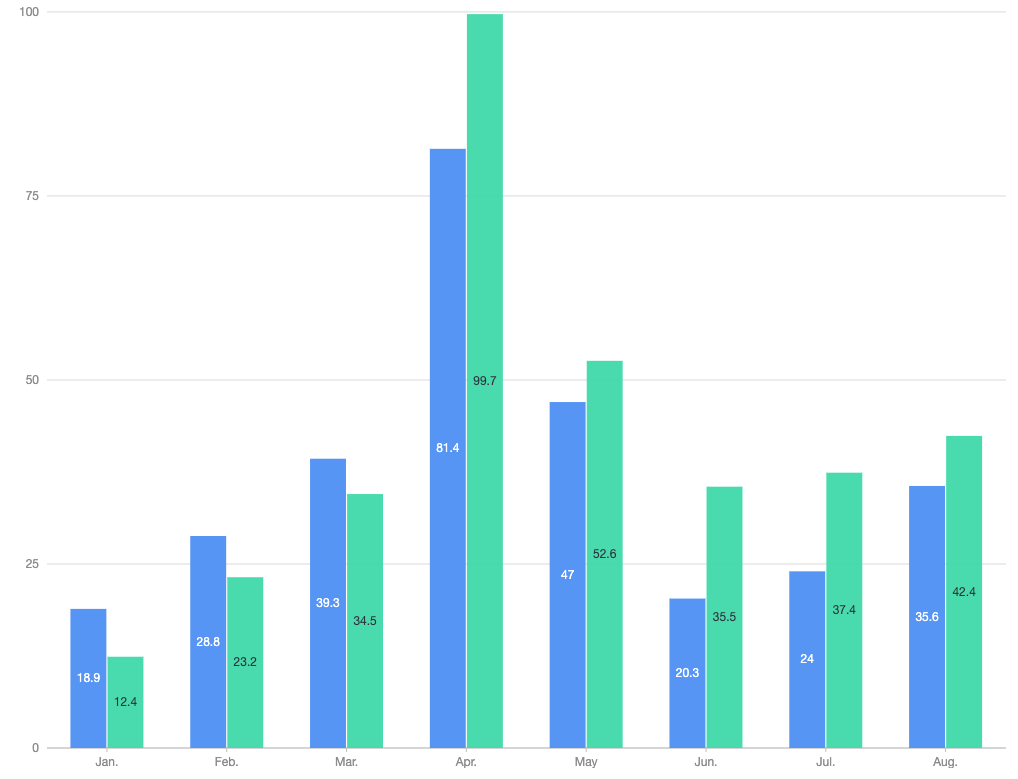
### 🥰 对称条形图支持分组,和分组柱状图一样,通过 seriesField 和 isGroup 字段配置。
类型下面的效果

Contributor guide
Research direction
Start by locating the symmetric bar chart implementation and the existing grouped column chart behavior. Trace how seriesField and isGroup are handled in both entry points, then reproduce the requested grouped symmetric-bar examples and verify that both configuration fields produce the expected chart output.
Written by the indexing model from the issue text.
Assessment
- Tech stack
- typescript
- Domain
- data-visualization
- Issue type
- Feature
- Difficulty
- 4/5
- Estimated time
- 3-5 days
- Activity status
- Stale
- Clarity
- Mostly clear
- Newbie friendliness
- 35/100