🐛 [BUG] 双轴图在有缩略轴slider 的时候,滑动slider范围 左右轴数据范围不一致 导致 图形错位
- Dominant language
- TypeScript
- Stars
- 2.7k
- Forks
- 591
- PR merge metrics
- No merged PRs in 30d
Description
### 🐛 Bug description 问题描述
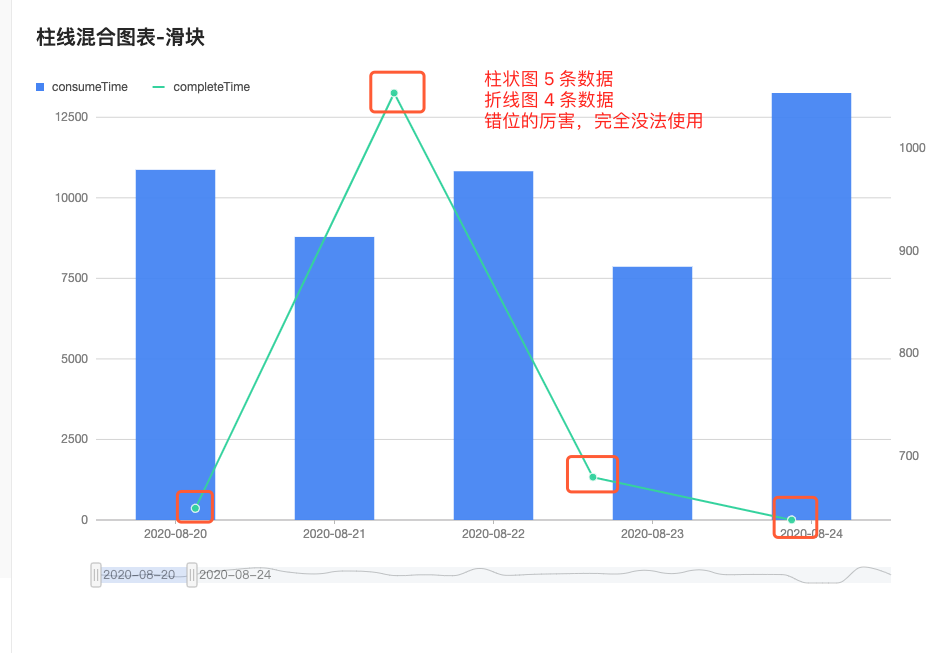
如图所示,官方的demo就可复现,调整缩略轴,左右轴图形错位,因为两侧数据 条数不一致。
https://g2plot.antv.antgroup.com/zh/examples/dual-axes/column-line/#slider-column-line
* _Required_ **Link to minimal reproduction**:
### 📷 Step to reproduce
### 🏞 期望修复,越快越好,非常影响使用
修复方式:slider change的时候,左右轴截取数据的时候,比对一下 条目是否合理
### 🚑 Any additional [like screenshots]
* **G2Plot Version**: 2.4.25
* **Platform**: chrome浏览器
*
Contributor guide
Research direction
Start with the linked dual-axes column-line slider demo and reproduce the misalignment in Chrome by moving the slider. Compare the left and right data ranges when their item counts differ; done means both plotted series remain aligned throughout slider changes. The issue does not name implementation files or tests, so trace the demo into the chart source and add coverage where the slider behavior is handled.
Written by the indexing model from the issue text.
Assessment
- Tech stack
- typescript
- Domain
- data-visualization, frontend
- Issue type
- Bug
- Difficulty
- 3/5
- Estimated time
- 1-2 days
- Activity status
- Stale
- Clarity
- Mostly clear
- Newbie friendliness
- 38/100