🥰 [FEATURE] MultiAxes plot
- Dominant language
- TypeScript
- Stars
- 2.7k
- Forks
- 591
- PR merge metrics
- No merged PRs in 30d
Description
### 🥰 Features description [Please make everyone to understand it]
- https://g2.antv.antgroup.com/examples/general/dual/#multi-line
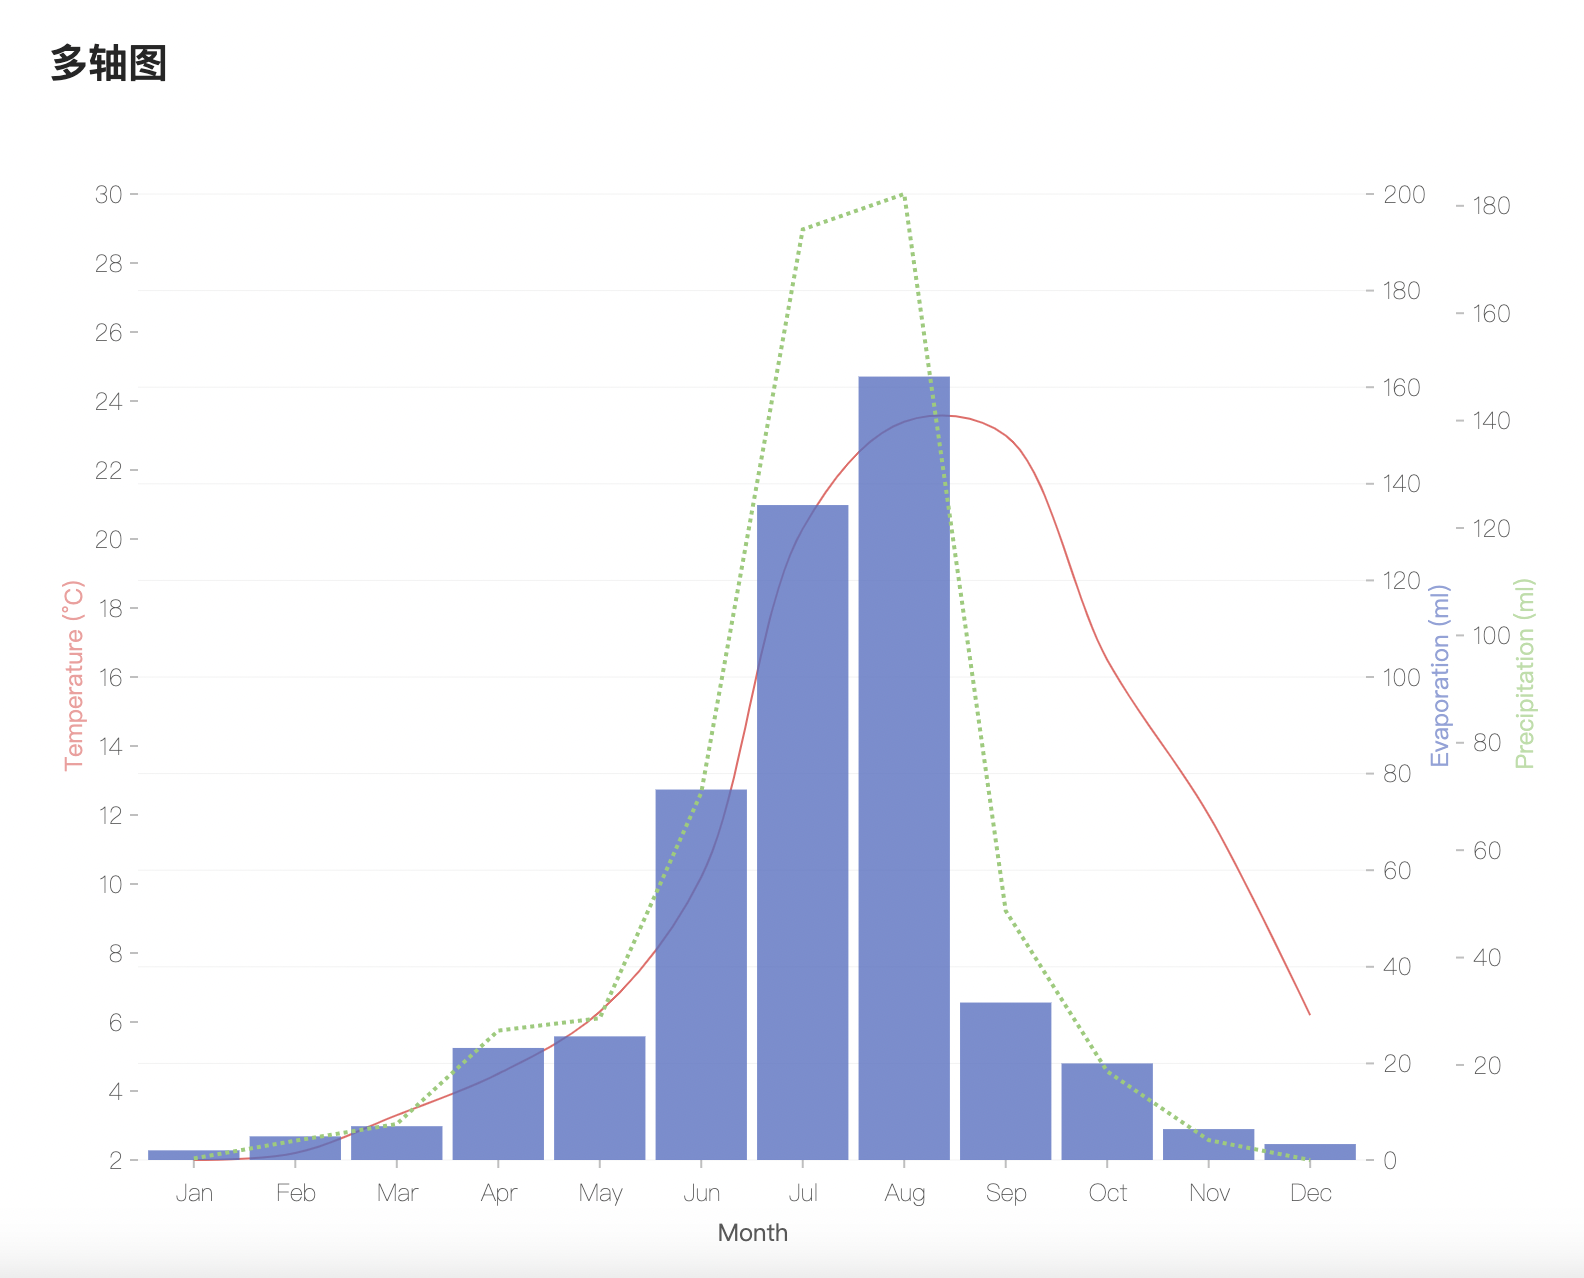
### 🏞 What problem does this feature solve
- It exists some scenario with multiple `Y` axis as `grafana` shows.
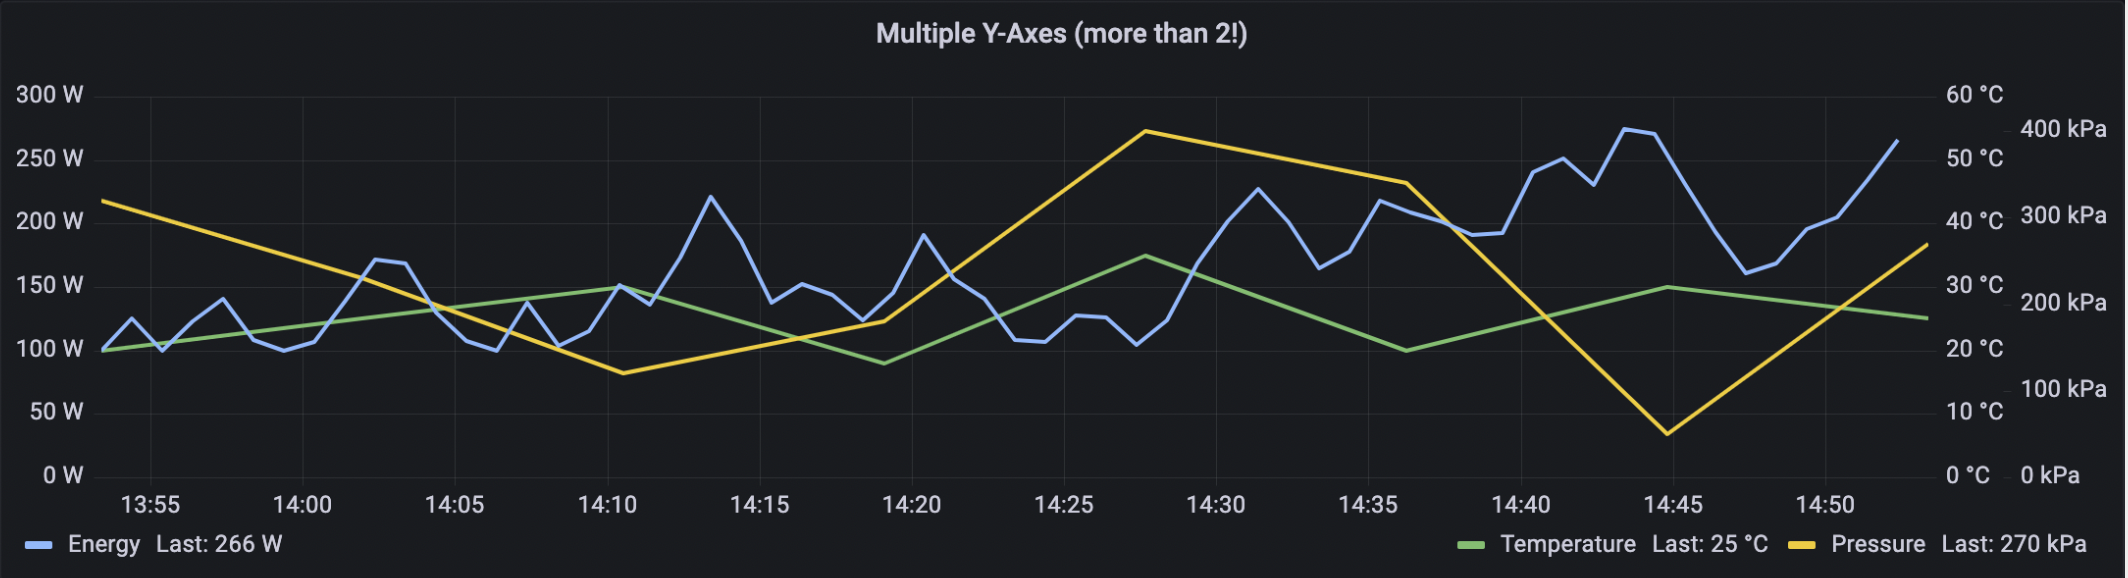
### 🧐 What does the proposed API look like
### 🚑 Any additional [like screenshots]
- ECharts demo with multiple `Y` axis: https://echarts.apache.org/examples/zh/editor.html?c=multiple-y-axis
Contributor guide
Research direction
No source file, test, or entry point is named in the issue. Review the linked G2Plot multi-line example, the Grafana reference, and the ECharts multiple-Y-axis demo to determine the required API and scope; done should mean that a chart can support multiple Y axes as described.
Written by the indexing model from the issue text.
Assessment
- Tech stack
- typescript
- Domain
- data-visualization
- Issue type
- Feature
- Difficulty
- 5/5
- Estimated time
- Over a week
- Activity status
- Stale
- Clarity
- Needs clarification
- Newbie friendliness
- 25/100