🤔 [QUESTION]当点击图例的某个选项后,触发了图表的渲染之后,想同步更新X轴的文字
Open
Question
- Dominant language
- TypeScript
- Stars
- 2.7k
- Forks
- 591
- PR merge metrics
- No merged PRs in 30d
Description
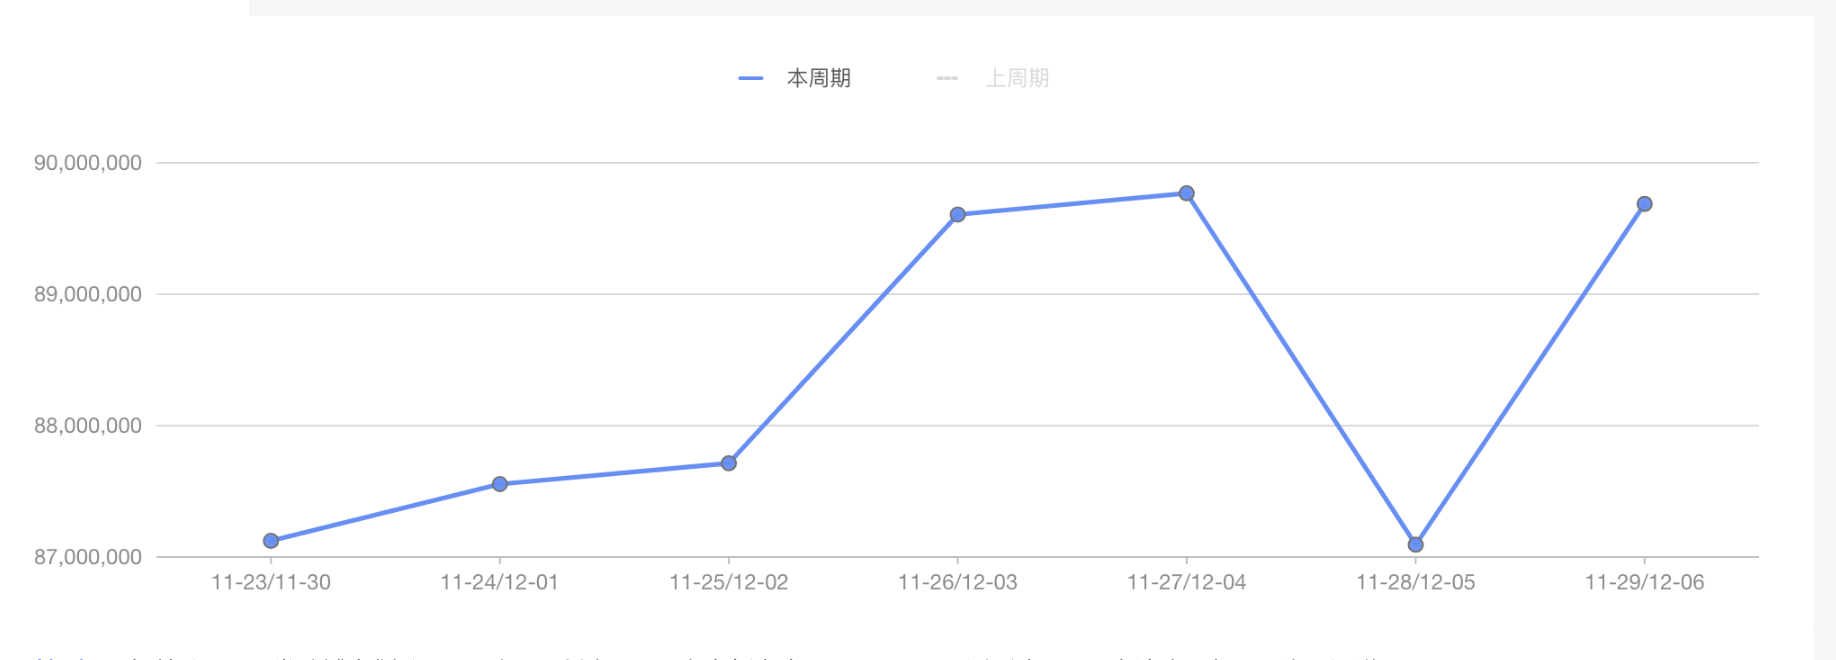
·比如当点击了上周期触发了图表的渲染之后,想同步更新X轴的文字,该怎么做?
Contributor guide
Research direction
Start with G2Plot's legend-selection and chart-rendering entry points, using the screenshot and the described “previous period” interaction to reproduce the behavior. Done means selecting a legend option causes the X-axis text to update in sync with the resulting chart render; the issue provides no file or test path, so locate the relevant API or example first.
Written by the indexing model from the issue text.
Assessment
- Tech stack
- typescript
- Domain
- data-visualization
- Issue type
- Feature
- Difficulty
- 3/5
- Estimated time
- 1-2 days
- Activity status
- Stale
- Clarity
- Needs clarification
- Newbie friendliness
- 25/100