🐛 [BUG] 在柱线混合图表中,且柱状图分组,线有多条的情况下,且数据时间分为前后两段,在点掉其中一个legend后,导致图与时间不对应
- Dominant language
- TypeScript
- Stars
- 2.7k
- Forks
- 591
- PR merge metrics
- No merged PRs in 30d
Description
### 🐛 Bug description [在柱线混合图表中,且柱状图分组,线有多条的情况下,且数据时间分为前后两段,在点掉其中一个legend后,导致图与时间不对应]
> Please provide a link by forking these links [G2Plot](https://codesandbox.io/s/g2plot-issue-template-gzfdq?file=/index.ts) or GitHub repo, a minimal reproduction.
* _Required_ **Link to minimal reproduction**: https://g2plot.antv.vision/zh/examples/dual-axes/column-line#column-line
### 📷 Step to reproduce
在柱线混合图表中,且柱状图分组,线有多条的情况下,且数据时间分为前后两段,在点掉其中一个legend后,导致图与时间不对应
代码如下:
`import { DualAxes } from '@antv/g2plot';
const data = [
{ time: '2019-03', value: 350, type:'a1' },
{ time: '2019-04', value: 900, type:'a1' },
{ time: '2019-05', value: 300, type:'a2' },
{ time: '2019-06', value: 450, type:'a2'},
];
const data2 = [
{ time: '2019-03', value: 350, type:'b1' },
{ time: '2019-04', value: 900, type:'b1' },
{ time: '2019-05', value: 300, type:'b2' },
{ time: '2019-06', value: 450, type:'b2' },
];
const dualAxes = new DualAxes('container', {
data: [data, data2],
xField: 'time',
yField: ['value', 'value'],
xAxis: {
type: 'timeCat',
},
geometryOptions: [
{
geometry: 'column',
seriesField: 'type',
isGroup: true,
},
{
geometry: 'line',
seriesField: 'type',
lineStyle: {
lineWidth: 2,
},
},
],
});
dualAxes.render();
`
### 🏞 Expected result
在点掉其中一个legend后,不会使得图与时间不对应
### 🚑 Any additional [like screenshots]
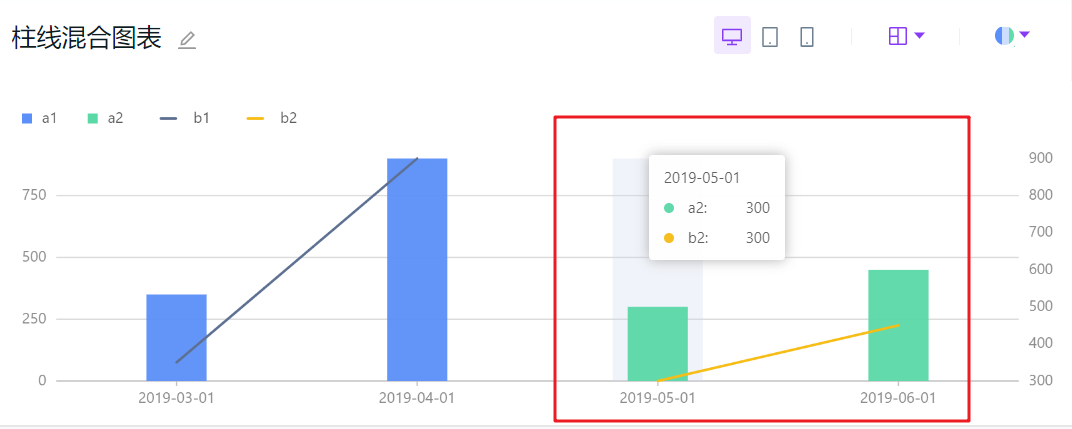
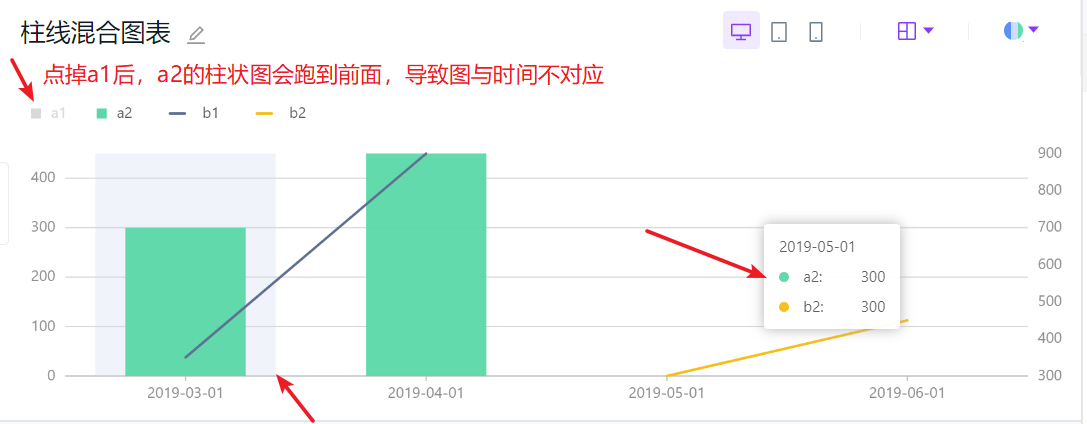
* **G2Plot Version**: ^2.3.40
* **Platform**:
Contributor guide
Research direction
Start with the linked DualAxes column-line example and reproduce the issue using the provided data, grouped columns, multiple lines, and timeCat x-axis. Toggle one legend item and compare the plotted positions with the time labels. Done means filtering a legend item no longer causes the chart data and time axis to become misaligned.
Written by the indexing model from the issue text.
Assessment
- Tech stack
- typescript
- Domain
- data-visualization
- Issue type
- Bug
- Difficulty
- 4/5
- Estimated time
- 3-5 days
- Activity status
- Stale
- Clarity
- Mostly clear
- Newbie friendliness
- 35/100