🐛 [BUG]柱状图自定义颜色后缩略轴拖动数据无法正确展示
Open
Bug
- Dominant language
- TypeScript
- Stars
- 2.7k
- Forks
- 591
- PR merge metrics
- No merged PRs in 30d
Description
### 🐛 Bug description [Please make everyone to understand it]
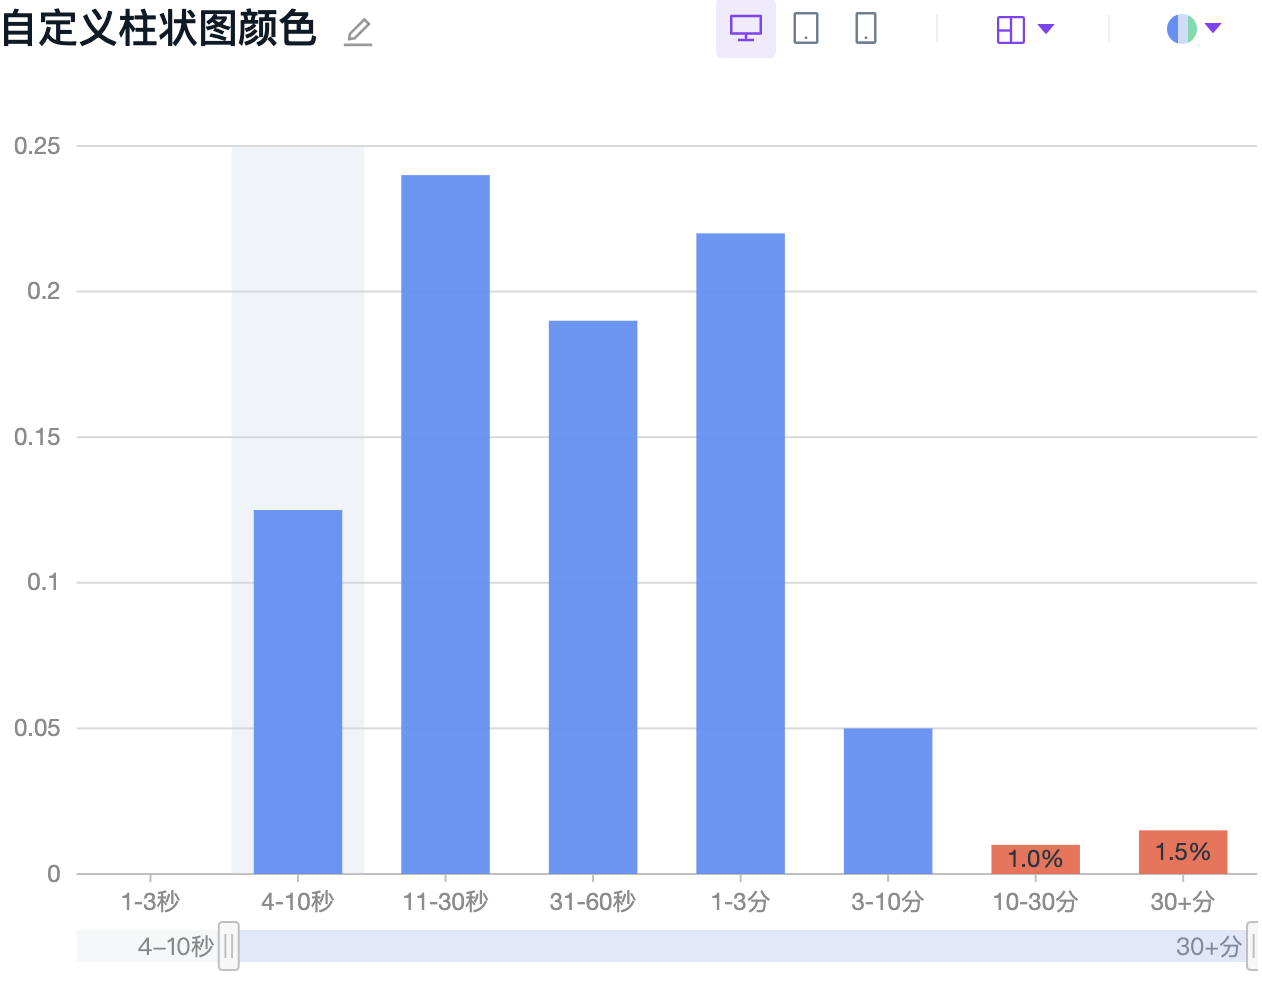
### 📷 Step to reproduce
### 🏞 Expected result
### 🚑 Any additional [like screenshots]
* **G2Plot Version**:
* **Platform**:
Contributor guide
Research direction
Start by reproducing the bar-chart case shown in the issue image, using custom colors and dragging the thumbnail axis. Identify the chart entry point and relevant reproduction setup; done means the dragged range displays the correct data while custom colors remain applied.
Written by the indexing model from the issue text.
Assessment
- Tech stack
- typescript
- Domain
- data-visualization
- Issue type
- Bug
- Difficulty
- 3/5
- Estimated time
- 1-2 days
- Activity status
- Stale
- Clarity
- Needs clarification
- Newbie friendliness
- 25/100