🐛 [BUG]柱状图在设置自定义颜色后meta中的alias失效
- Dominant language
- TypeScript
- Stars
- 2.7k
- Forks
- 591
- PR merge metrics
- No merged PRs in 30d
Description
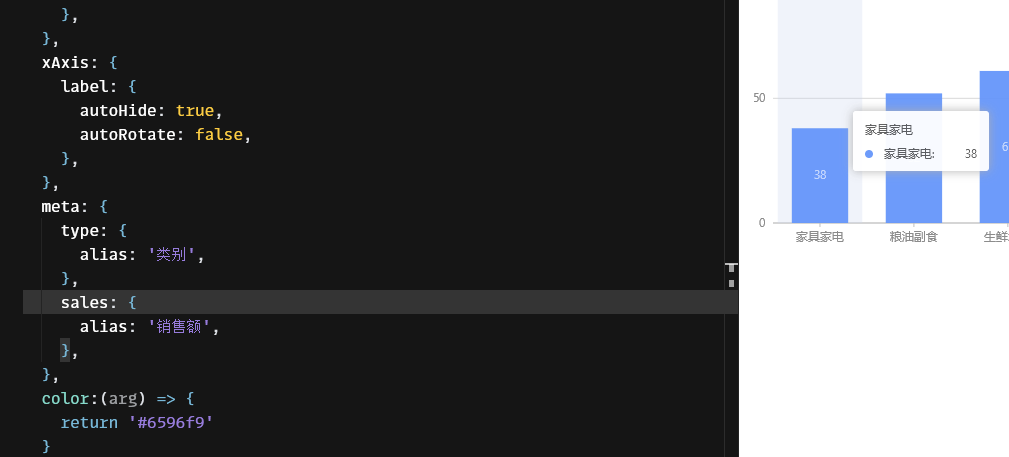
### 🐛 Bug description 柱状图在设置自定义颜色后meta中的alias失效
**Link to minimal reproduction**: https://codesandbox.io/s/hungry-carson-xb8gh7
### 📷 Step to reproduce
Column配置项:
```
meta: {
type: {
alias: '类别',
},
sales: {
alias: '销售额',
},
},
color:(arg) => {
return '#6596f9'
}
```
### 🏞 Expected result
柱状图颜色与Tooltip 按配置显示
### 🚑 Any additional [like screenshots]
颜色生效 但Tooltip未按照配置进行显示
* **G2Plot Version**:
* **Platform**:
Contributor guide
Research direction
Start with the linked CodeSandbox reproduction and the Column configuration using meta aliases together with a custom color function. Trace the Column chart's tooltip and alias handling, then confirm that the custom color still applies while the configured aliases appear in the tooltip.
Written by the indexing model from the issue text.
Assessment
- Tech stack
- typescript
- Domain
- data-visualization, frontend
- Issue type
- Bug
- Difficulty
- 3/5
- Estimated time
- 1-2 days
- Activity status
- Stale
- Clarity
- Mostly clear
- Newbie friendliness
- 45/100