🤔 [QUESTION] 桑基图效果
- Dominant language
- TypeScript
- Stars
- 2.7k
- Forks
- 591
- PR merge metrics
- No merged PRs in 30d
Description
### 🐛 Question description [Please make everyone to understand it]
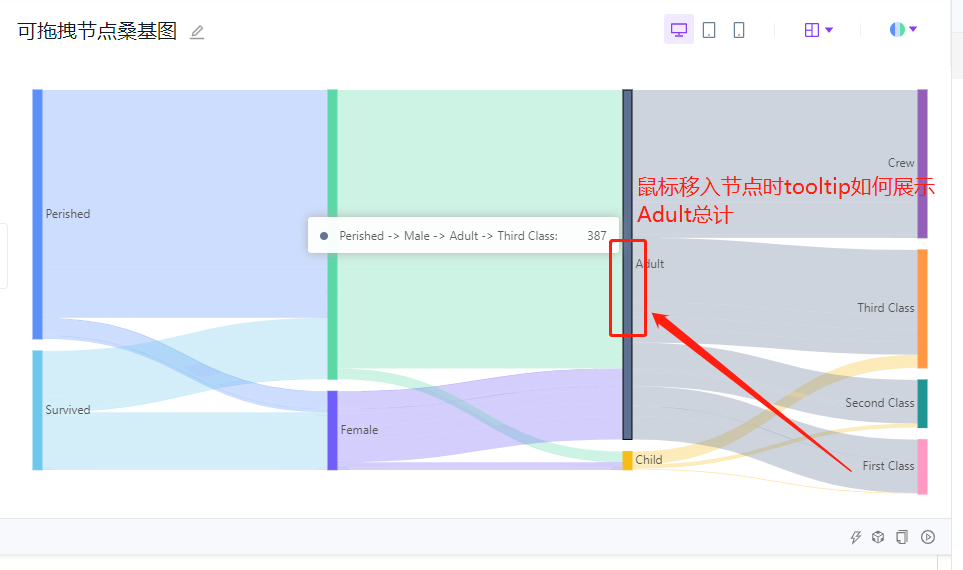
如图所示,鼠标移入节点时,如何显示总计,并下一层所有数据流高亮显示
### 💻 Link to minimal reproduction
Please provide a link by forking these links [g2plot](https://codesandbox.io/s/g2plot-reproduction-template-gyej1) or GitHub repo. What is a minimal reproduction, and why is it required?
### 🏞 Expected result
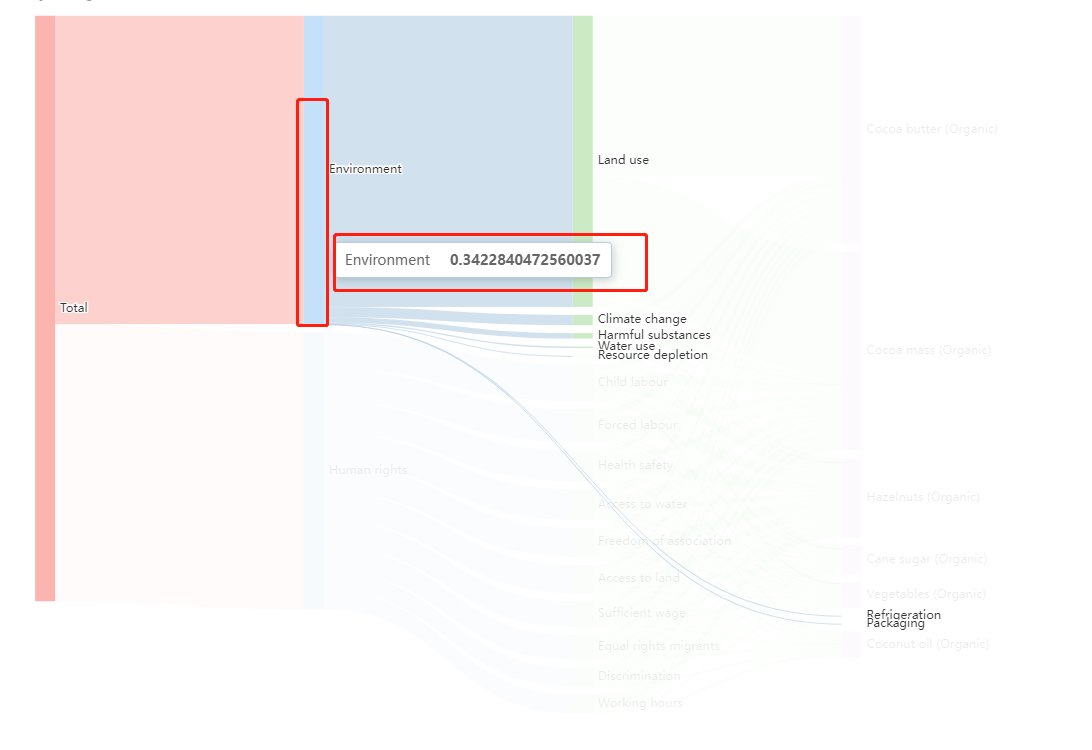
期望效果,如图所示
### 🚑 Any additional [like screenshots]
* **G2Plot Version**:
* **Platform**:
Contributor guide
Research direction
Start with the linked G2Plot reproduction template and compare the two screenshots to understand the requested Sankey hover behavior. Confirm the G2Plot version and platform, then define done as showing the node total and highlighting all data flows in the next layer on hover.
Written by the indexing model from the issue text.
Assessment
- Tech stack
- typescript
- Domain
- data-visualization
- Issue type
- Feature
- Difficulty
- 4/5
- Estimated time
- 3-5 days
- Activity status
- Stale
- Clarity
- Needs clarification
- Newbie friendliness
- 25/100