🐛 [BUG] g2plot 分类玫瑰图 最小值 设置 为数据最小值时,渲染会有问题
Open
Bug
- Dominant language
- TypeScript
- Stars
- 2.7k
- Forks
- 591
- PR merge metrics
- No merged PRs in 30d
Description
desc: 当设置 yAxis 的 min 为数据最小值时,会出现渲染问题
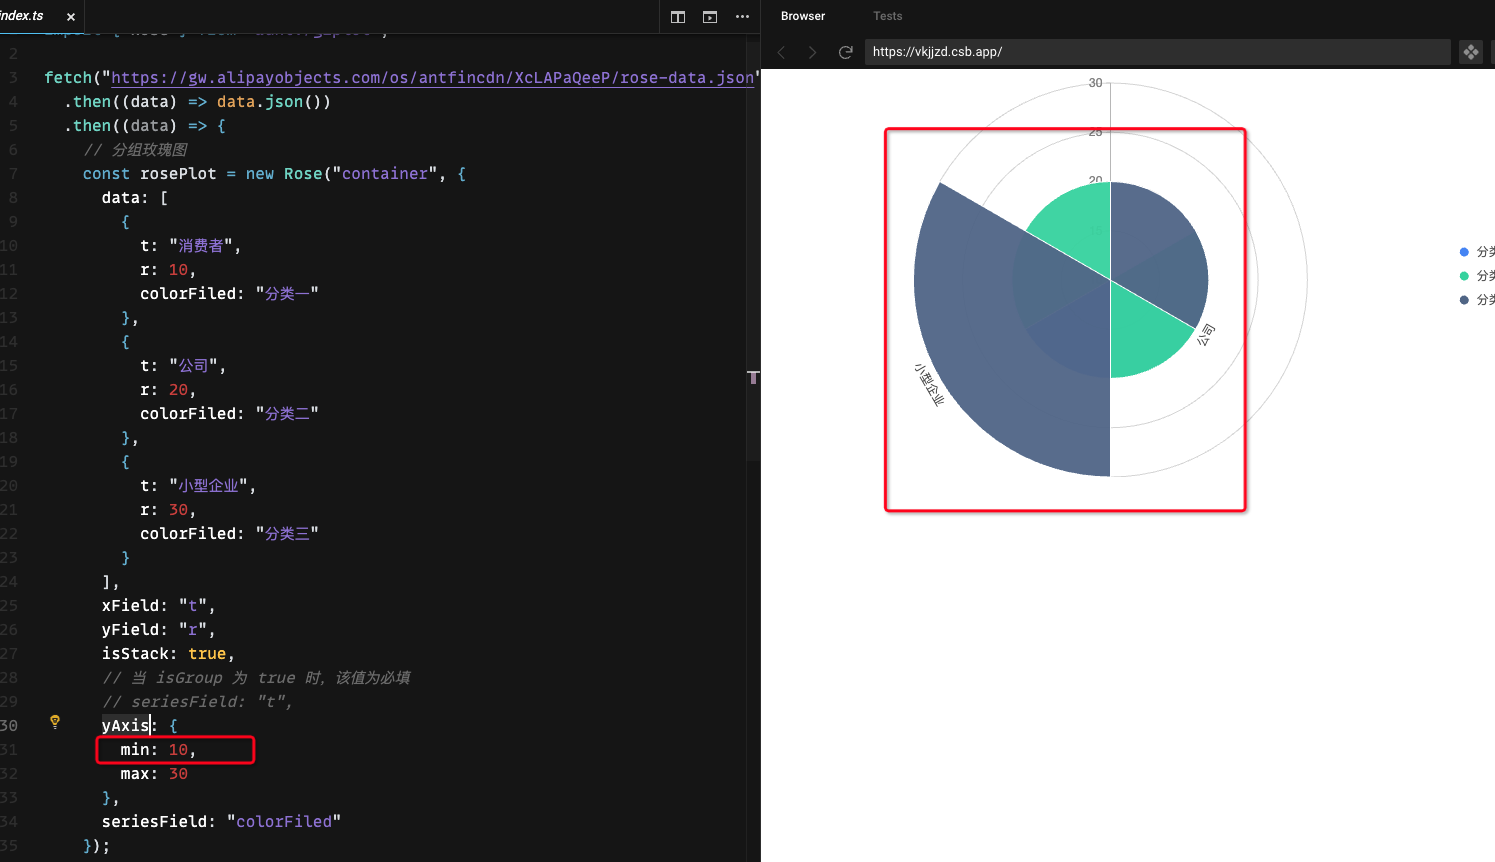
复现:https://codesandbox.io/s/exciting-grass-vkjjzd?file=/index.ts
* **G2Plot Version**: 2.4.20
* **Platform**: g2plot
Contributor guide
Research direction
Start with the linked CodeSandbox reproduction in index.ts and inspect the categorical rose chart with yAxis.min set to the data minimum. Compare it with rendering when the minimum is changed, then trace the related G2Plot chart entry point. Done means the chart renders correctly when yAxis.min equals the data minimum.
Written by the indexing model from the issue text.
Assessment
- Tech stack
- typescript
- Domain
- data-visualization
- Issue type
- Bug
- Difficulty
- 3/5
- Estimated time
- 1-2 days
- Activity status
- Stale
- Clarity
- Mostly clear
- Newbie friendliness
- 42/100