🐛 [BUG]
- Dominant language
- TypeScript
- Stars
- 2.7k
- Forks
- 591
- PR merge metrics
- No merged PRs in 30d
Description
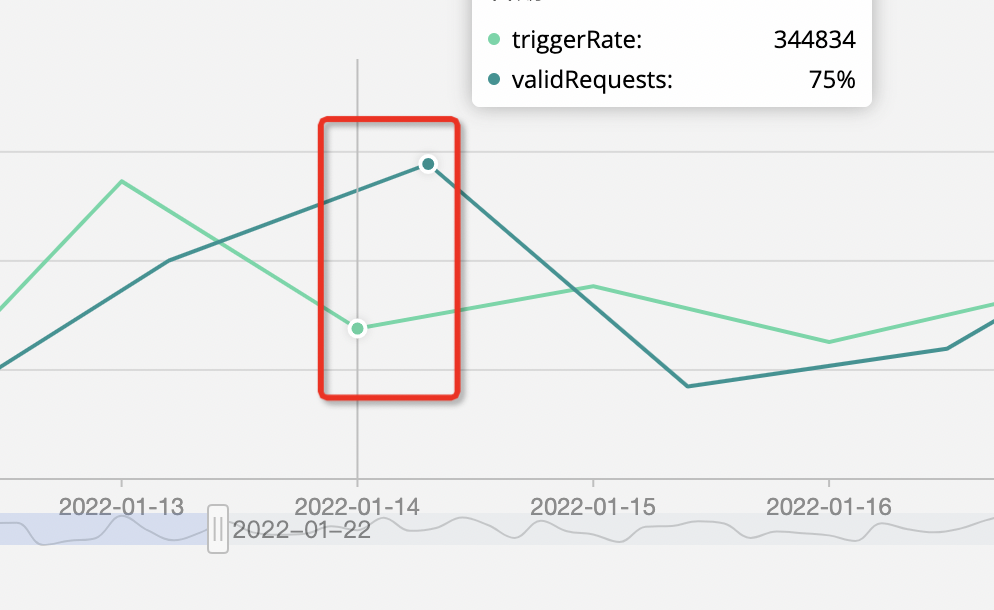
### 🐛 Bug description [Please make everyone to understand it]
+ 双轴图多折线
+ slider 拖动时,会导致两个轴的数据没有对应在一个直线上
> Please provide a link by forking these links [G2Plot](https://codesandbox.io/s/g2plot-issue-template-gzfdq?file=/index.ts) or GitHub repo, a minimal reproduction.
* _Required_ **Link to minimal reproduction**:
### 📷 Step to reproduce
### 🏞 Expected result
+ 期望是在一个直线上数据都相对应
### 🚑 Any additional [like screenshots]
* **G2Plot Version**: 最新版本2.4.20
* **Platform**: mac 谷歌浏览器
Contributor guide
Research direction
Start with the G2Plot dual-axis multi-line chart described in the issue and inspect the attached screenshot, using G2Plot 2.4.20 in Chrome on macOS. Reproduce the slider interaction and determine why the two axes' data no longer align; done means the corresponding values remain on one line while dragging the slider.
Written by the indexing model from the issue text.
Assessment
- Tech stack
- typescript
- Domain
- data-visualization
- Issue type
- Bug
- Difficulty
- 4/5
- Estimated time
- 3-5 days
- Activity status
- Stale
- Clarity
- Needs clarification
- Newbie friendliness
- 25/100