🤔 [QUESTION] - Support for `IGroup` in `AxisLabelCfg` - formatter
Open
Question
- Dominant language
- TypeScript
- Stars
- 2.7k
- Forks
- 591
- PR merge metrics
- No merged PRs in 30d
Description
### 🐛 Does Axis Label `formatter` or `content` option support `IGroup`
### 🏞 Expected result
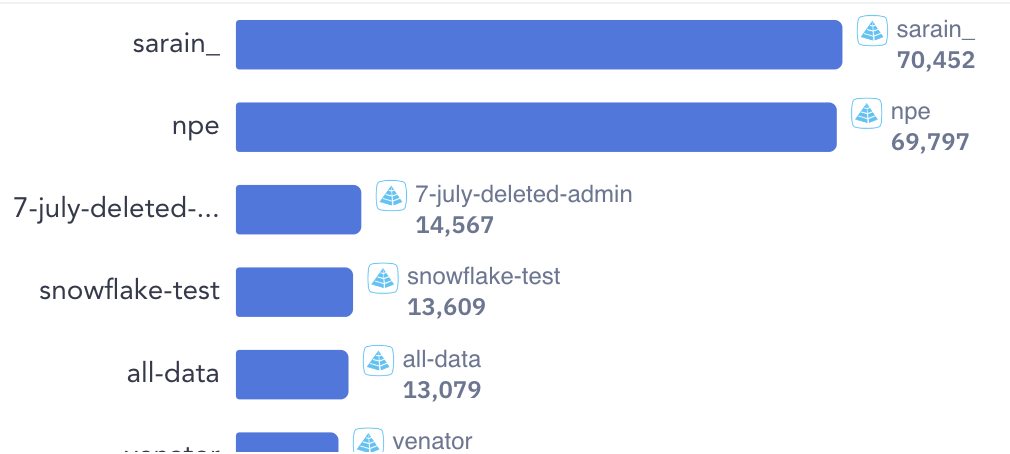
I want to be able to apply the same formatting as used in the label (right side, with the icon) in the yAxis label (left side, only text), but it looks like
### 🚑 Any additional [like screenshots]
* **G2Plot Version**: 2.4.20
Contributor guide
Research direction
Start by tracing the AxisLabelCfg formatter and content options and the IGroup type in G2Plot's chart configuration and rendering entry points. Compare the existing right-side label formatting with the yAxis label shown in the screenshot; done means the requested formatting is supported consistently or the limitation is documented.
Written by the indexing model from the issue text.
Assessment
- Tech stack
- typescript
- Domain
- data-visualization
- Issue type
- Feature
- Difficulty
- 4/5
- Estimated time
- 3-5 days
- Activity status
- Stale
- Clarity
- Needs clarification
- Newbie friendliness
- 30/100