🐛 [BUG]Mix组件不支持annotations
- Dominant language
- TypeScript
- Stars
- 2.7k
- Forks
- 591
- PR merge metrics
- No merged PRs in 30d
Description
### 🐛 Bug description [Please make everyone to understand it]
annotations 属性文档上说明可用,但实际不生效
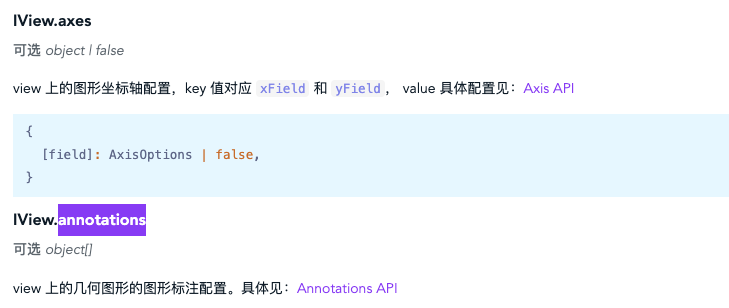
官网示例简单加一下属性
```js
import { Mix } from '@antv/g2plot';
fetch('https://gw.alipayobjects.com/os/antfincdn/qE48lpzwRc/range-area-data.json')
.then((data) => data.json())
.then((data) => {
const { area: data1, line: data2 } = data;
const rangeAreaPlot = new Mix('container', {
appendPadding: 8,
syncViewPadding: true,
tooltip: { shared: true, showMarkers: false, showCrosshairs: true, offsetY: -50 },
views: [
{
data: data2,
axes: {},
meta: {
time: {
type: 'time',
mask: 'MM-DD',
nice: true,
tickInterval: 24 * 3600 * 1000 * 2,
range: [0, 1],
},
temperature: {
sync: 'temperature',
alias: '温度',
},
},
//annotations
"annotations": [
{
"type": 'regionFilter',
"start": [0, "min"],
"end": [1247011200000, "max"],
"color": '#F4664A',
},
],
// view2: prepare a line plot and point plot, mapping position to `time*temperature` (share data)
geometries: [
{
type: 'line',
xField: 'time',
yField: 'temperature',
mapping: {},
},
{
type: 'point',
xField: 'time',
yField: 'temperature',
mapping: {
shape: 'circle',
style: {
fillOpacity: 1,
},
},
},
],
},
],
});
// Step 3: 渲染图表
rangeAreaPlot.render();
});
```
### 📷 Step to reproduce
### 🏞 Expected result
### 🚑 Any additional [like screenshots]
* **G2Plot Version**: 官网示例
* **Platform**: JS
Contributor guide
Research direction
Start with the supplied Mix range-area example and compare its annotations configuration with the documented API. Trace how Mix handles view options to determine why annotations are ignored, then reproduce the example and verify that the regionFilter annotation renders.
Written by the indexing model from the issue text.
Assessment
- Tech stack
- javascript
- Domain
- data-visualization
- Issue type
- Bug
- Difficulty
- 3/5
- Estimated time
- 1-2 days
- Activity status
- Stale
- Clarity
- Needs clarification
- Newbie friendliness
- 35/100