🤔 [QUESTION] y轴动态增长的label会将title挤到图外
- Dominant language
- TypeScript
- Stars
- 2.7k
- Forks
- 591
- PR merge metrics
- No merged PRs in 30d
Description
### 🐛 Question description [Please make everyone to understand it]
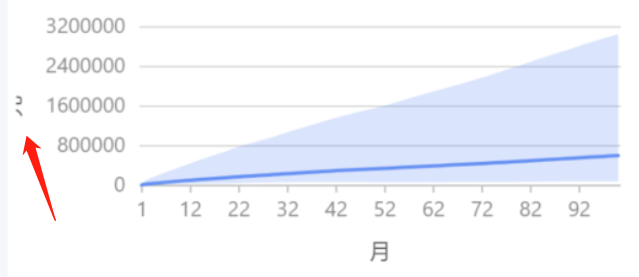
y轴的label会动态变长,一开始是100、200,后面可能变成100000、200000,就将y轴的title挤到图的左侧外部去了。目前不希望对y轴做log scale,也不希望预留比较大的空间。
我翻了文档,目前是使用update appendPadding解决的:
`plot.update({ appendPadding: [16, 16, 16, 16 + maxYValueLength * 6 ] })`
但每次update会导致整个图重绘一次,没有changeData流畅。当然这种update的情况不多,默认还是走changeData。
自己还不太了解G2Plot,因为感觉是比较常见的情形,想请教下有解决办法吗?谢谢~
### 🚑 Any additional [like screenshots]
图:y轴的title被挤到图外部
Contributor guide
Research direction
Start by reproducing the y-axis title layout with dynamically growing labels, then compare the documented update({ appendPadding }) workaround with changeData. Done means the title remains inside the chart as label widths grow without requiring a large reserved margin or a log scale.
Written by the indexing model from the issue text.
Assessment
- Tech stack
- typescript
- Domain
- data-visualization
- Issue type
- Bug
- Difficulty
- 5/5
- Estimated time
- Over a week
- Activity status
- Stale
- Clarity
- Needs clarification
- Newbie friendliness
- 25/100