🐛 [BUG] 双轴图框选后,部分数据线会出现在 X 轴下方,框选重置后仍然有问题
- Dominant language
- TypeScript
- Stars
- 2.7k
- Forks
- 591
- PR merge metrics
- No merged PRs in 30d
Description
### 🐛 Bug description [Please make everyone to understand it]
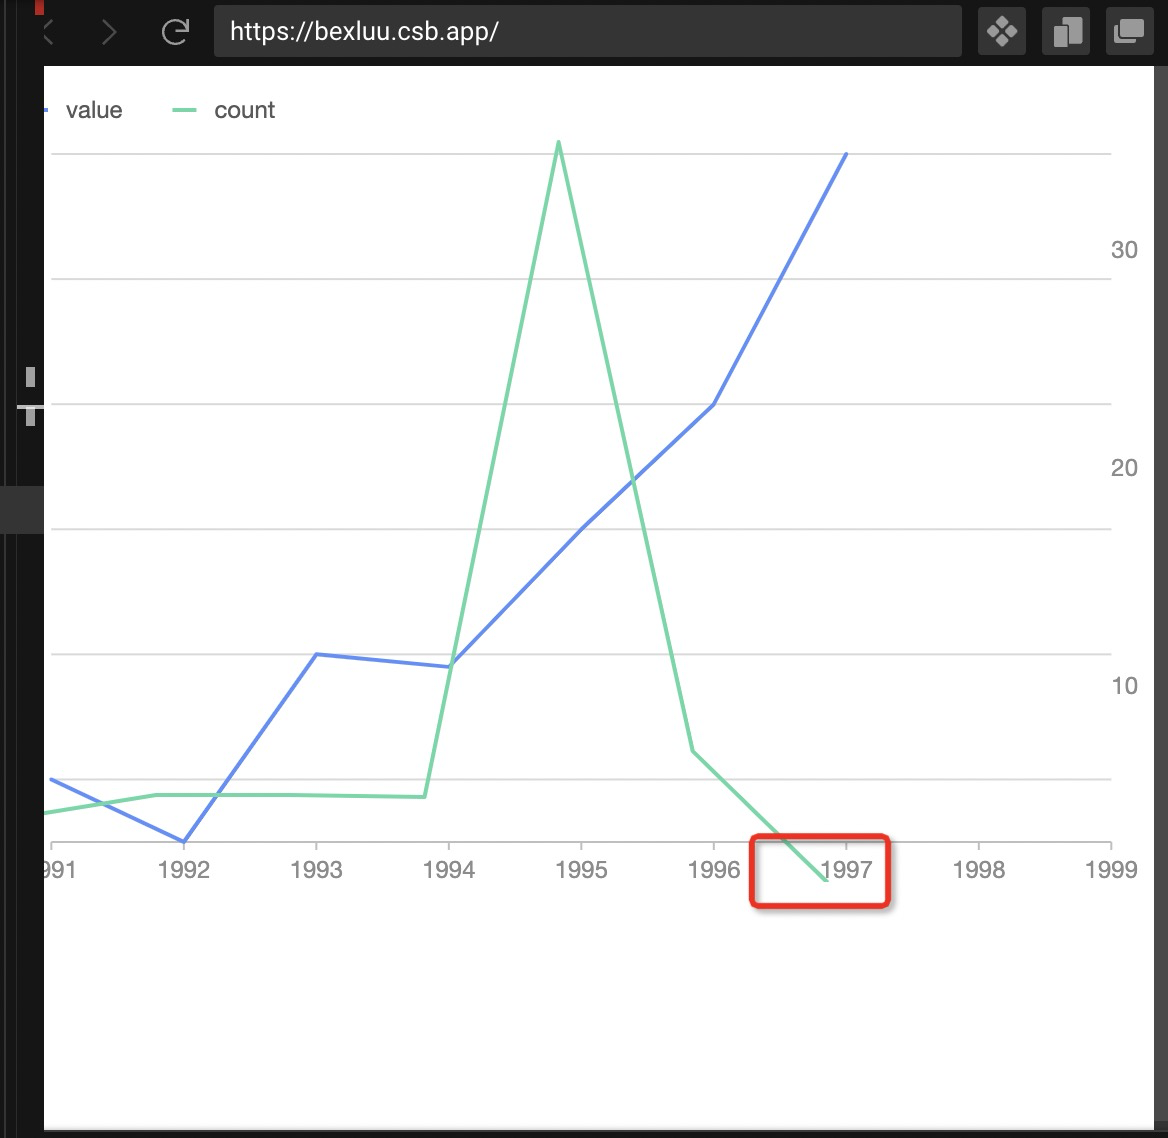
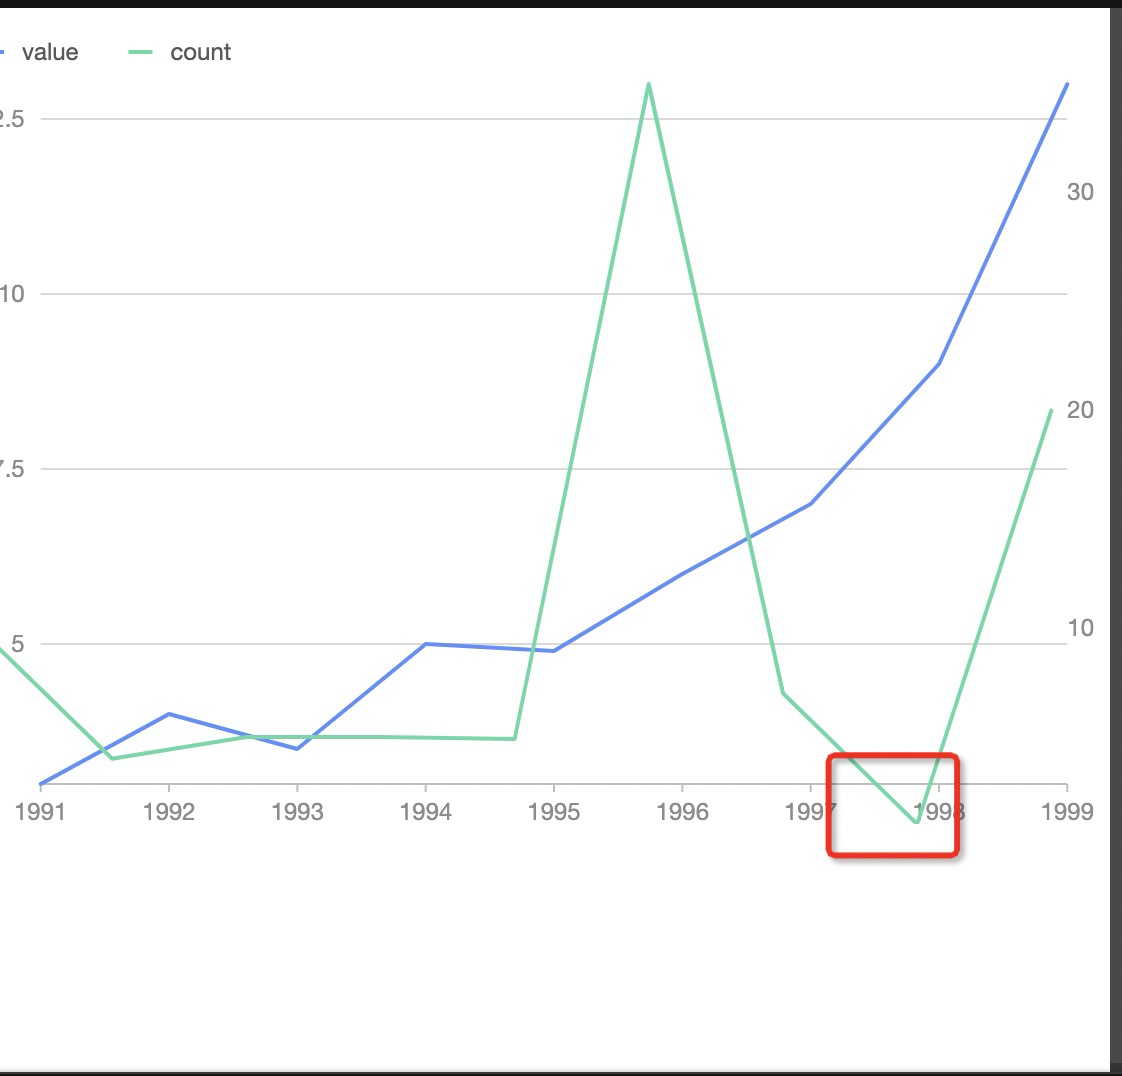
* _Required_ **Link to minimal reproduction**: https://codesandbox.io/s/staging-pond-bexluu?file=/index.ts
### 📷 Step to reproduce
1. 打开重现链接: [reproduction](https://codesandbox.io/s/staging-pond-bexluu?file=/index.ts)
2. 进行框选交互即可重现
### 🏞 Expected result
- 所有数据线均出现在 X 轴或 X 轴上方
### 🚑 Any additional [like screenshots]
* **G2Plot Version**: 2.4.16
* **Platform**:
Contributor guide
Research direction
Start with the linked CodeSandbox reproduction at index.ts and reproduce the dual-axis chart's box-selection interaction using G2Plot 2.4.16. Investigate the behavior before and after resetting the selection; done means every data line remains on or above the X axis.
Written by the indexing model from the issue text.
Assessment
- Tech stack
- typescript
- Domain
- data-visualization
- Issue type
- Bug
- Difficulty
- 3/5
- Estimated time
- 1-2 days
- Activity status
- Stale
- Clarity
- Mostly clear
- Newbie friendliness
- 45/100