🐛 [BUG] 「折线图」组件高度的变化,导致label显示有问题
- Dominant language
- TypeScript
- Stars
- 2.7k
- Forks
- 591
- PR merge metrics
- No merged PRs in 30d
Description
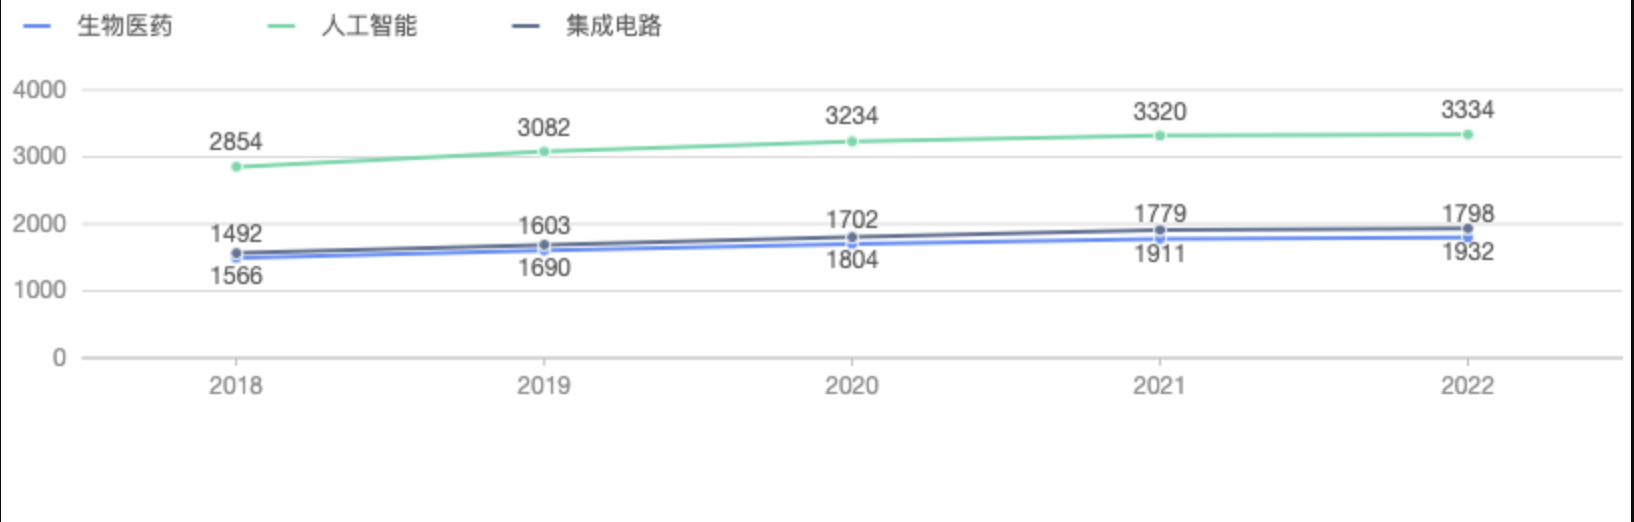
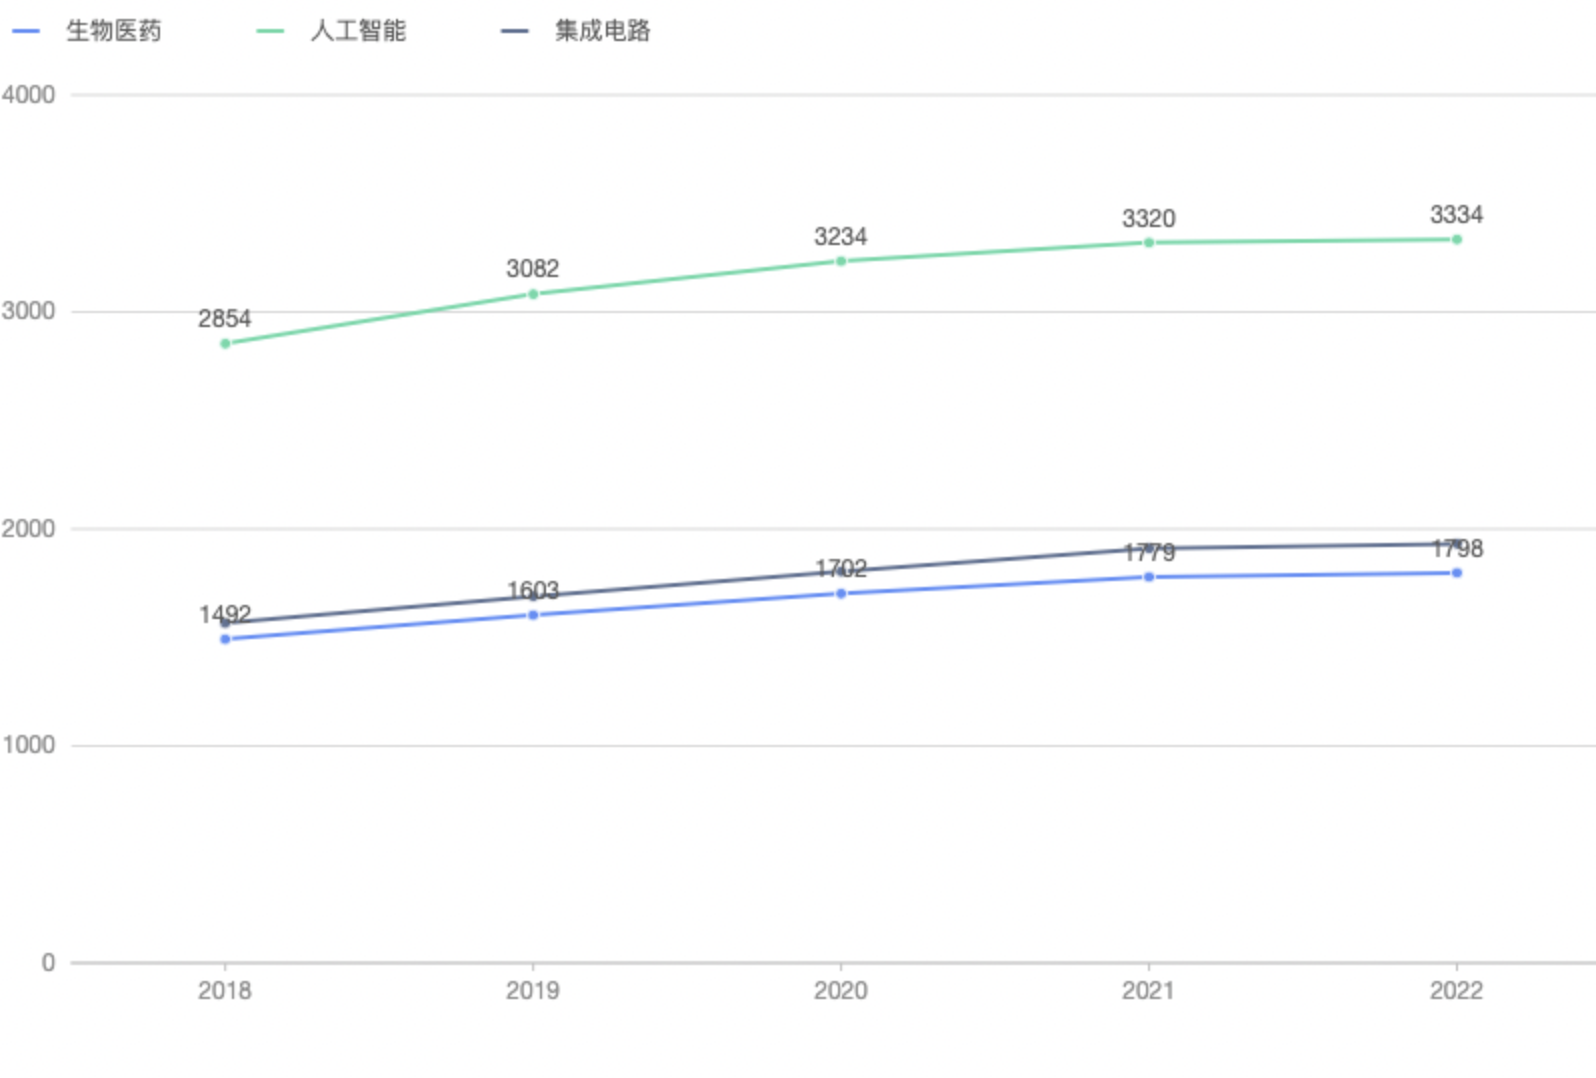
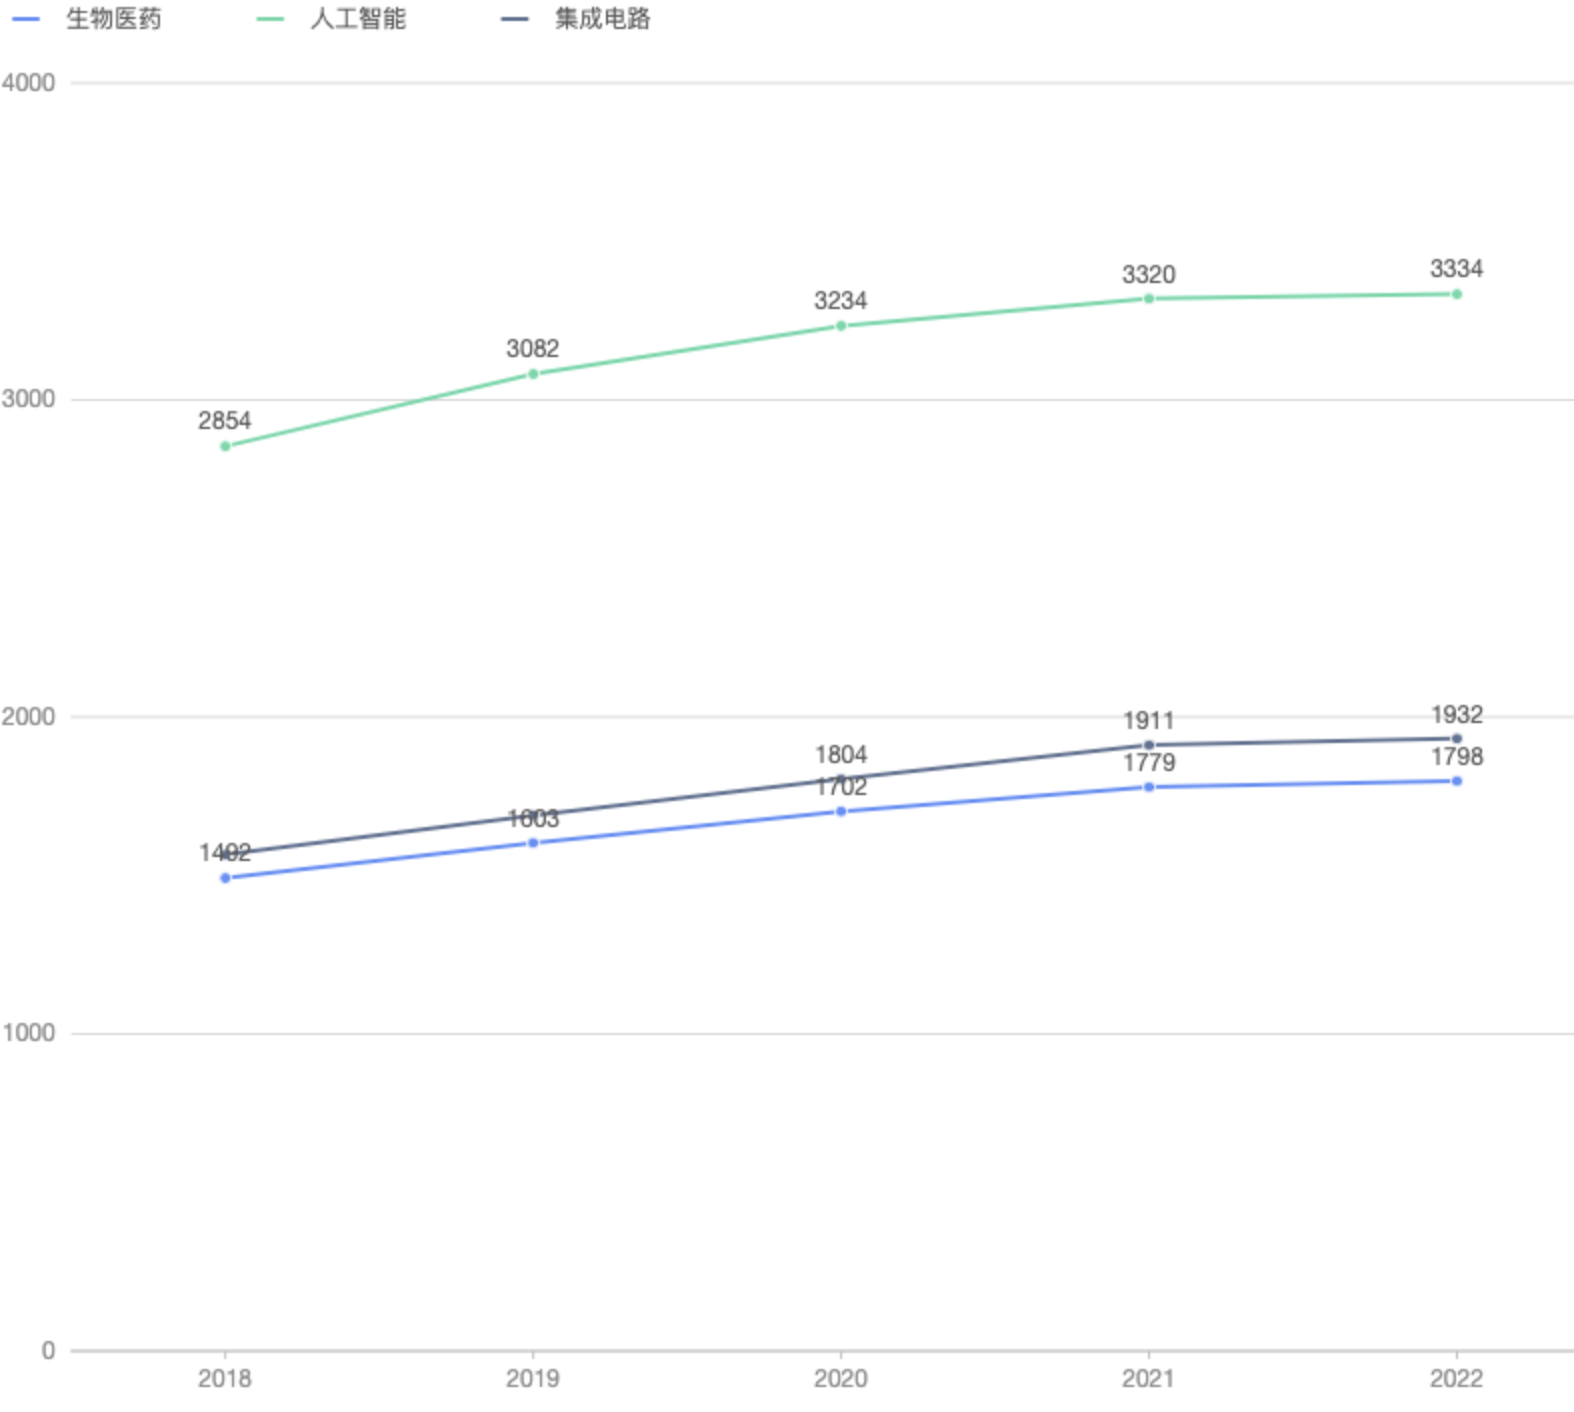
问题描述进一步细化:使用当前用例数据,组件高度的变化,会导致label显示有问题,截图如下
测试地址: https://stackblitz.com/edit/react-nxqldi?file=src/index.js
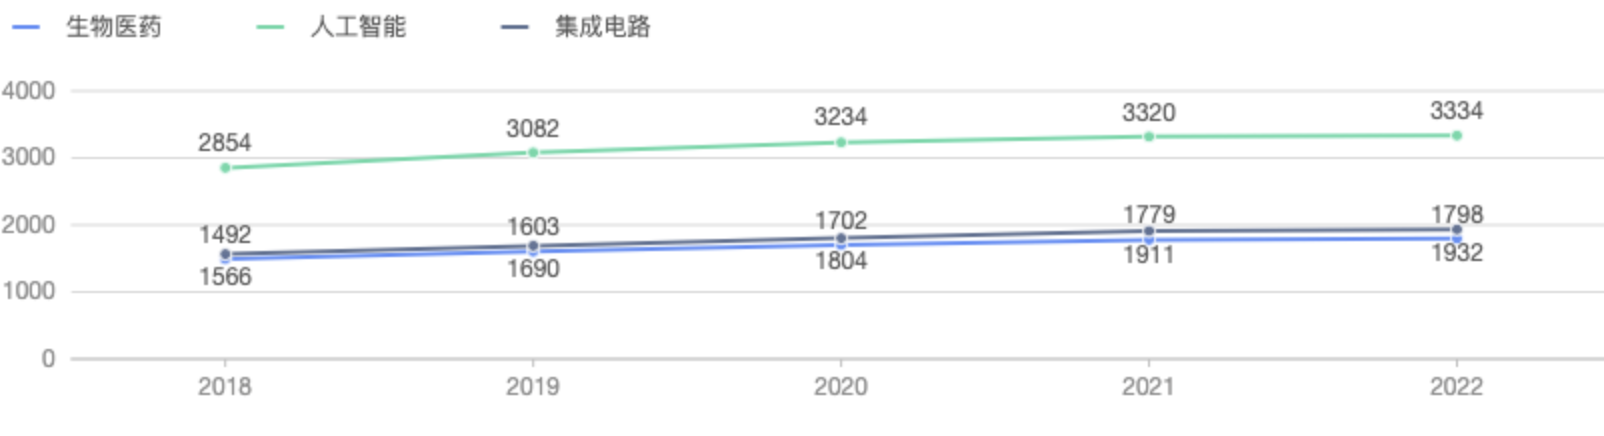
期望效果( height: 200 ):
高度变化后的效果( height: 500 ):
高度变化后的效果( height: 700 ):
g2plot 折线图 默认Layout如下:
```js
layout: [
{ type: 'limit-in-plot' },
{ type: 'path-adjust-position' },
{ type: 'point-adjust-position' },
{ type: 'limit-in-plot', cfg: { action: 'hide' } },
],
```
合理猜测,g2中 Geometry label 这几个默认的内置布局函数,计算异常
1. pathAdjustPosition: 适用于 point geometry 的数据标签位置自动调整布局方法
[`src/geometry/label/layout/path/adjust-position.ts`](https://github.com/antvis/G2/blob/e62d824c1722fffac6973a53b0d80bd608a238f9/src/geometry/label/layout/path/adjust-position.ts#L70)
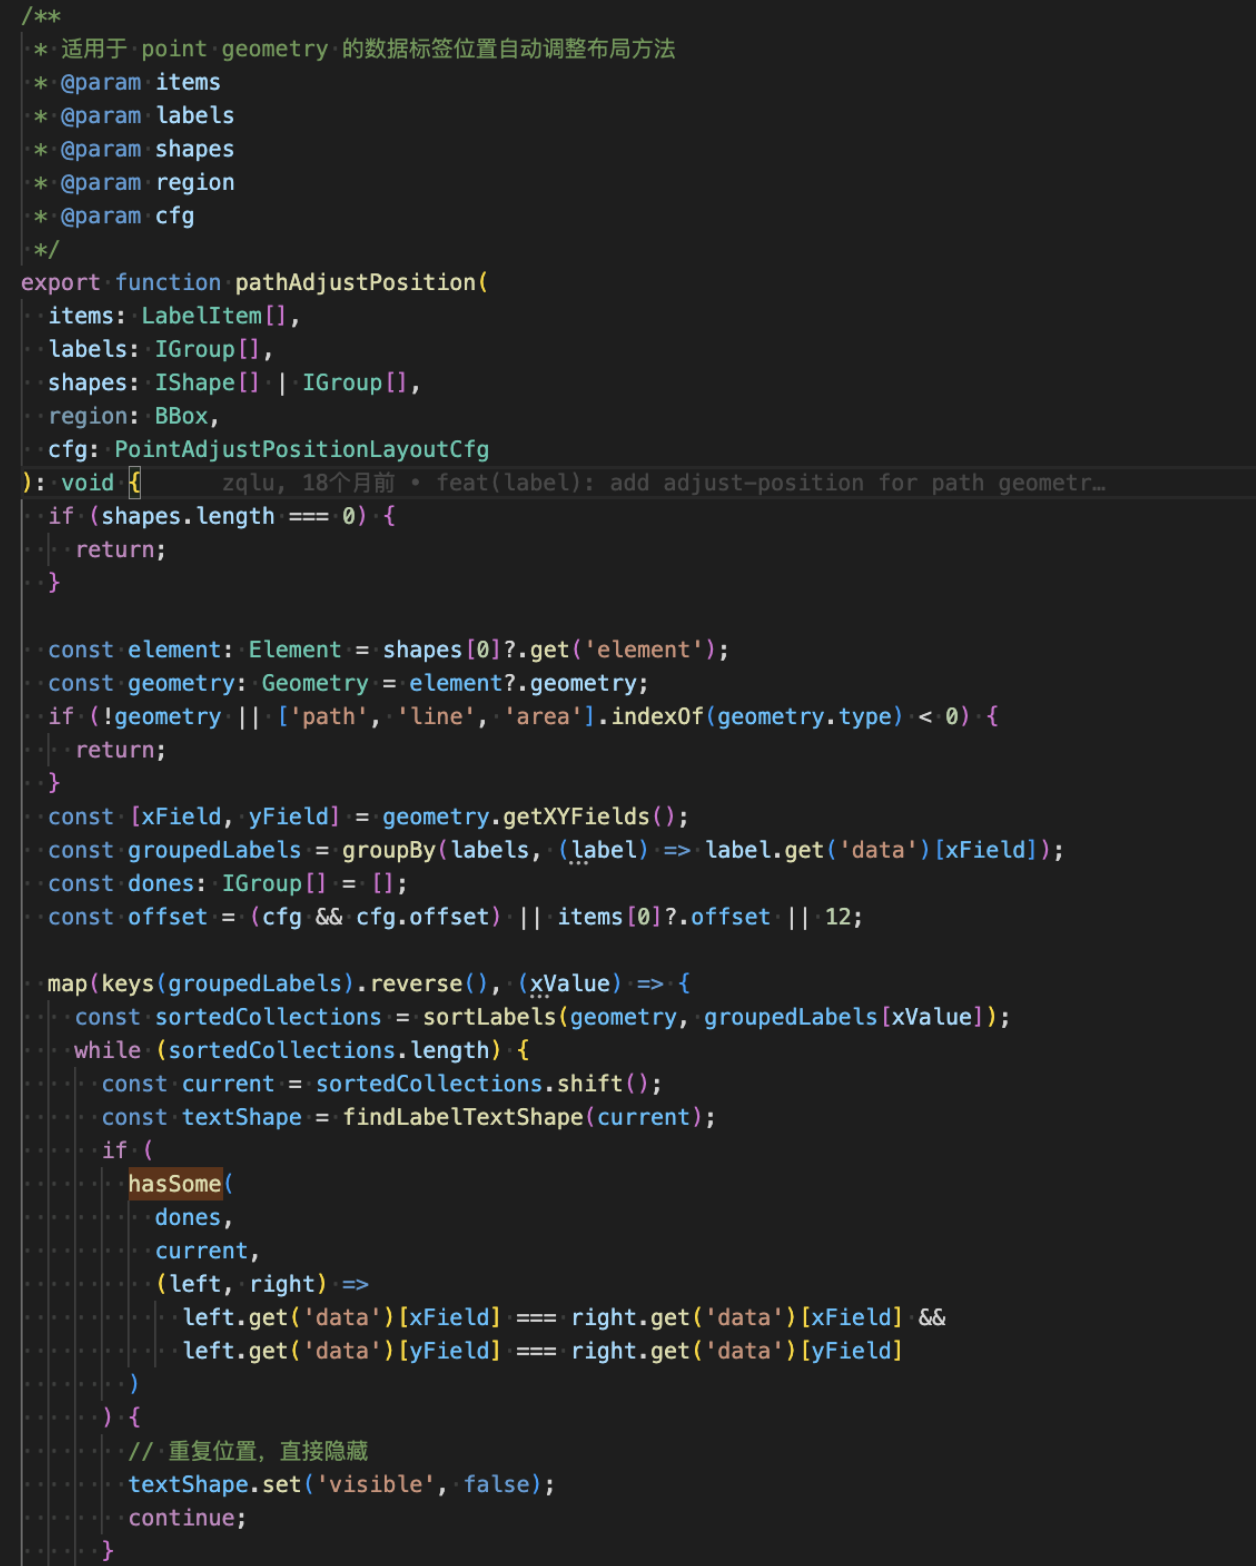
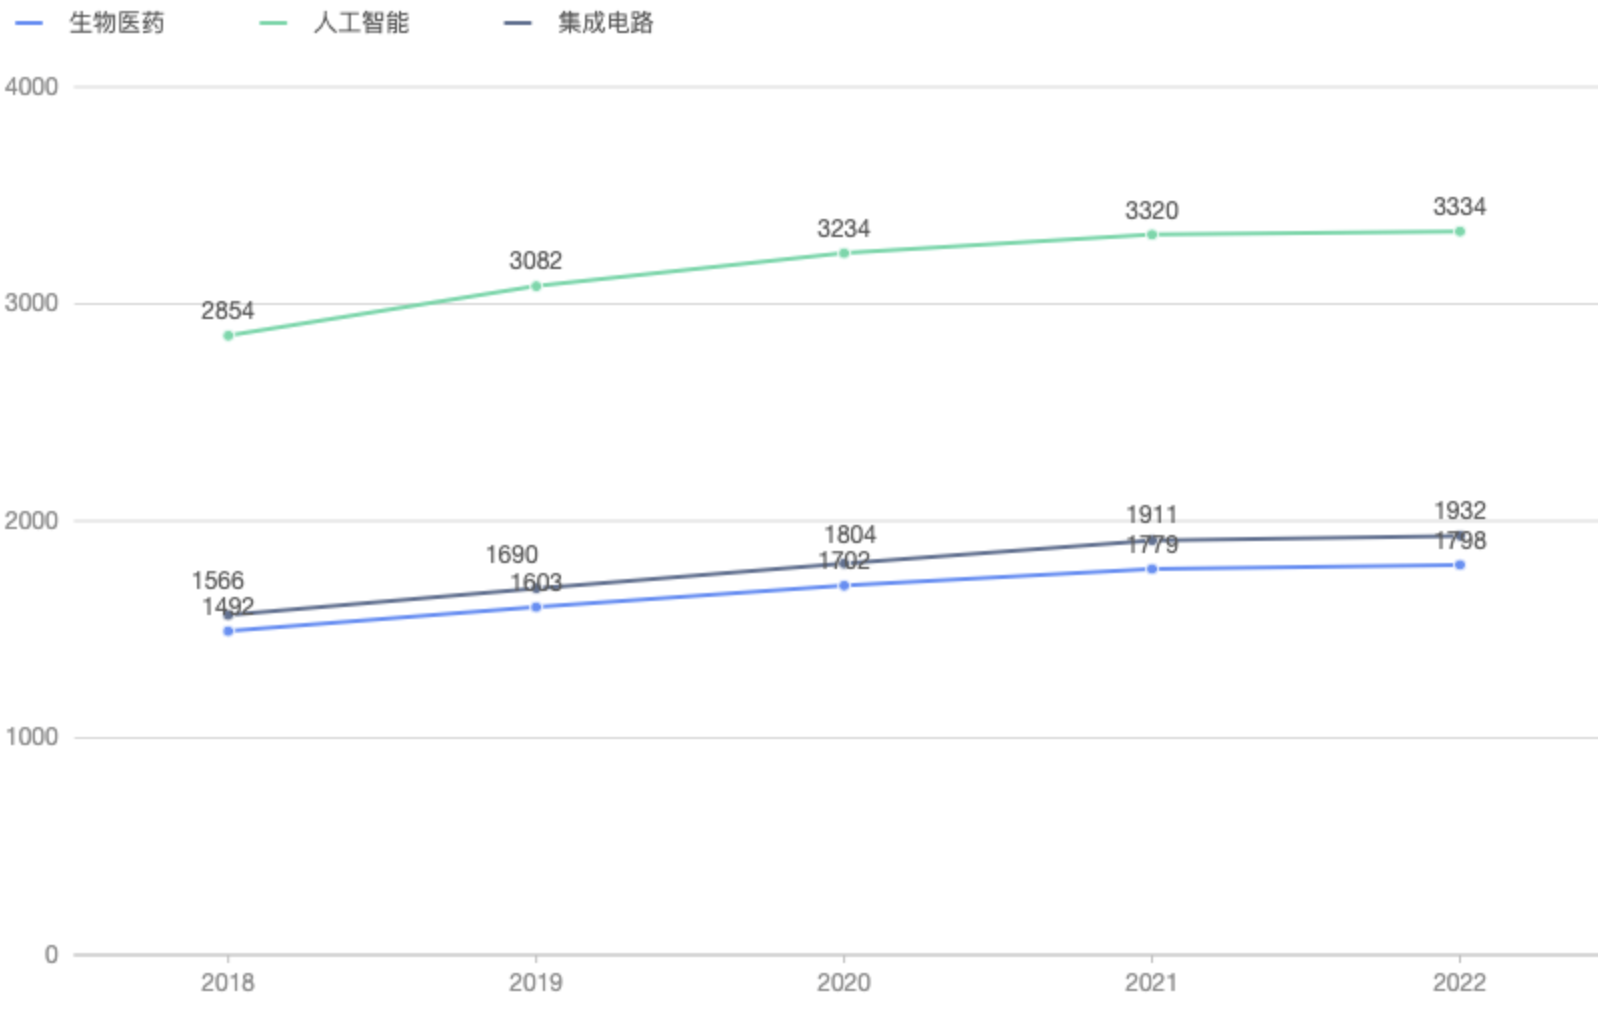
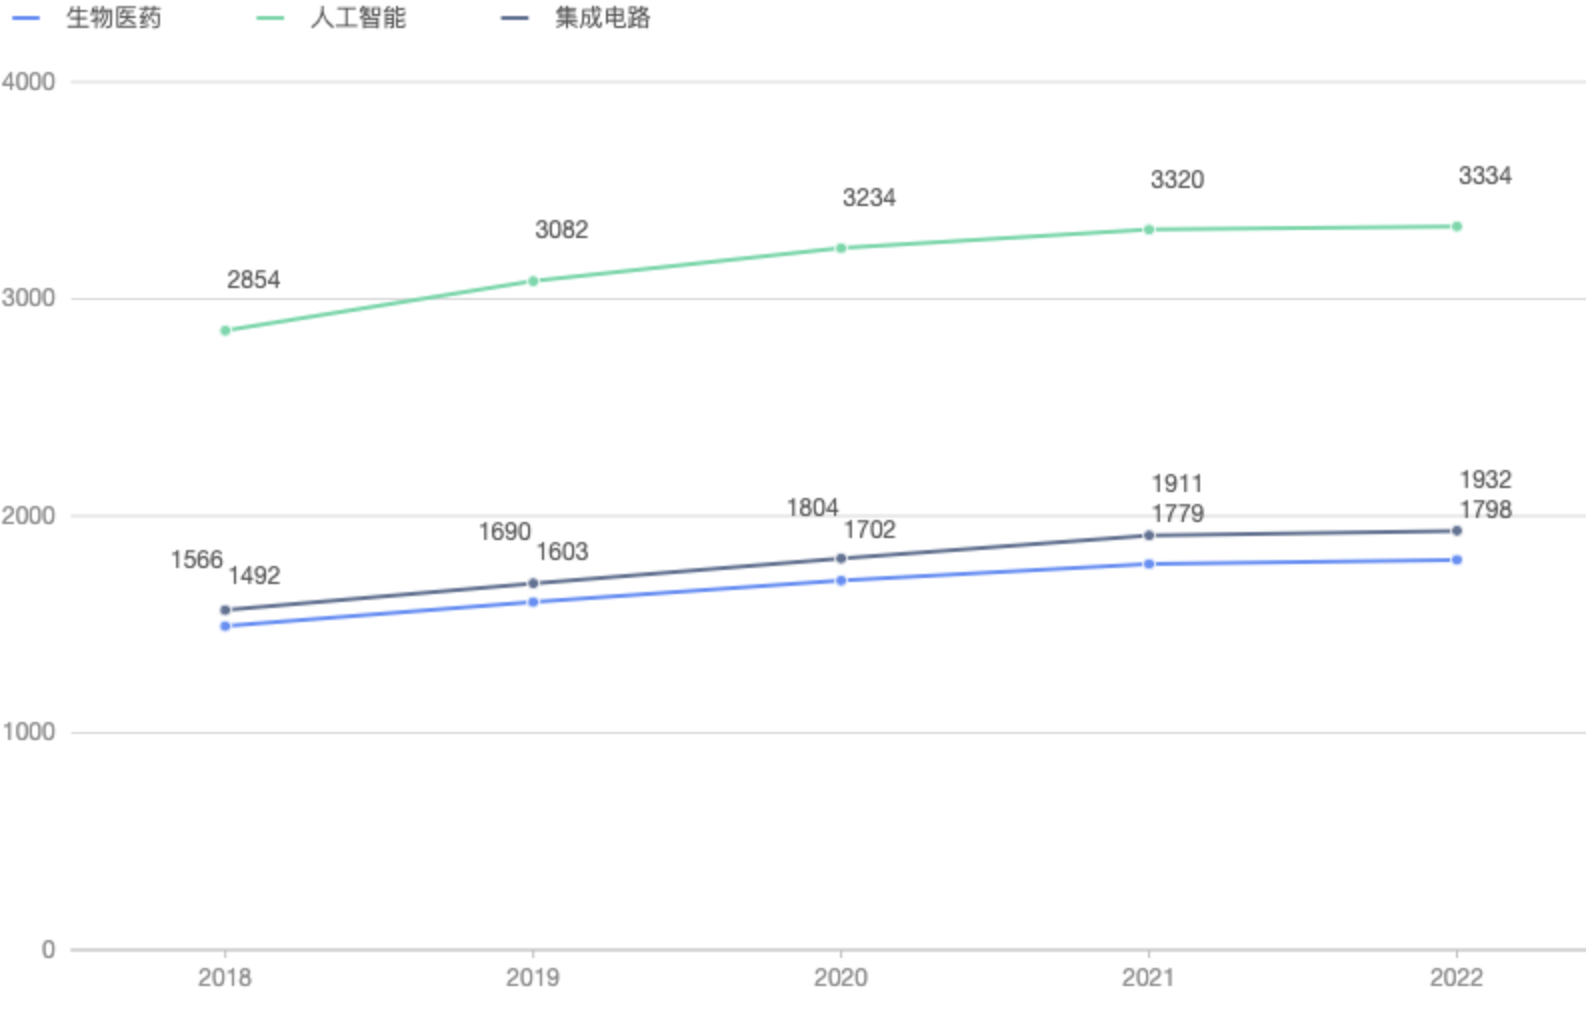
2. layout可以调整为 overlap、fixed-overlap ,但在当前给出的测试场景下,相对于默认的效果来说,可能这两种layout都不太能够被接受,截图如下。
default
fixed-overlap
overlap
Contributor guide
Research direction
Start with the linked StackBlitz reproduction and inspect src/geometry/label/layout/path/adjust-position.ts, especially the pathAdjustPosition behavior. Reproduce the line-chart label issue at heights 200, 500, and 700, then verify that labels remain correctly positioned across those heights without unacceptable overlap.
Written by the indexing model from the issue text.
Assessment
- Tech stack
- typescript
- Domain
- data-visualization
- Issue type
- Bug
- Difficulty
- 4/5
- Estimated time
- 3-5 days
- Activity status
- Stale
- Clarity
- Mostly clear
- Newbie friendliness
- 38/100