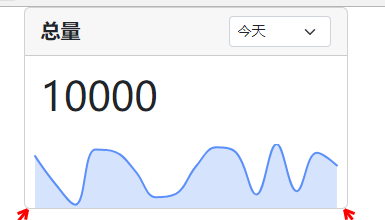
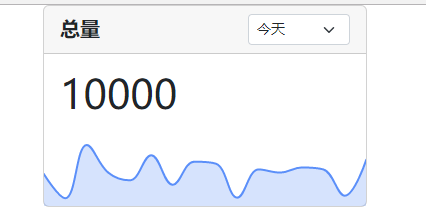
自适应大小autoFit设置为true,曲线左右有空白,并未完全填充
- Dominant language
- TypeScript
- Stars
- 2.7k
- Forks
- 591
- PR merge metrics
- No merged PRs in 30d
Description
### 自适应大小autoFit设置为true,曲线左右有空白,如何设置成完全填充
目前曲线自适应曲线左右存在空白,虽然可以通过padding参数进行消除,但是在不同分辨率下可能还是会出现左右的空白区域,请问有什么方法可取消取消左右的空白?
### 问题截图
- 目前问题,左右存在空白,曲线没有完全填充
- 希望的效果,曲线自适应完全填充,不能有空白
* **G2Plot Version**: https://unpkg.com/@antv/g2plot@2.4.16/dist/g2plot.min.js
* **Platform**: javascript
Contributor guide
Research direction
Start by reproducing the chart behavior with G2Plot 2.4.16 using autoFit set to true, comparing the reported padding workaround across resolutions. Inspect the chart sizing and padding configuration; done means the curve fills the available horizontal area without left or right blank space.
Written by the indexing model from the issue text.
Assessment
- Tech stack
- javascript, typescript
- Domain
- data-visualization
- Issue type
- Bug
- Difficulty
- 3/5
- Estimated time
- 1-2 days
- Activity status
- Stale
- Clarity
- Needs clarification
- Newbie friendliness
- 35/100