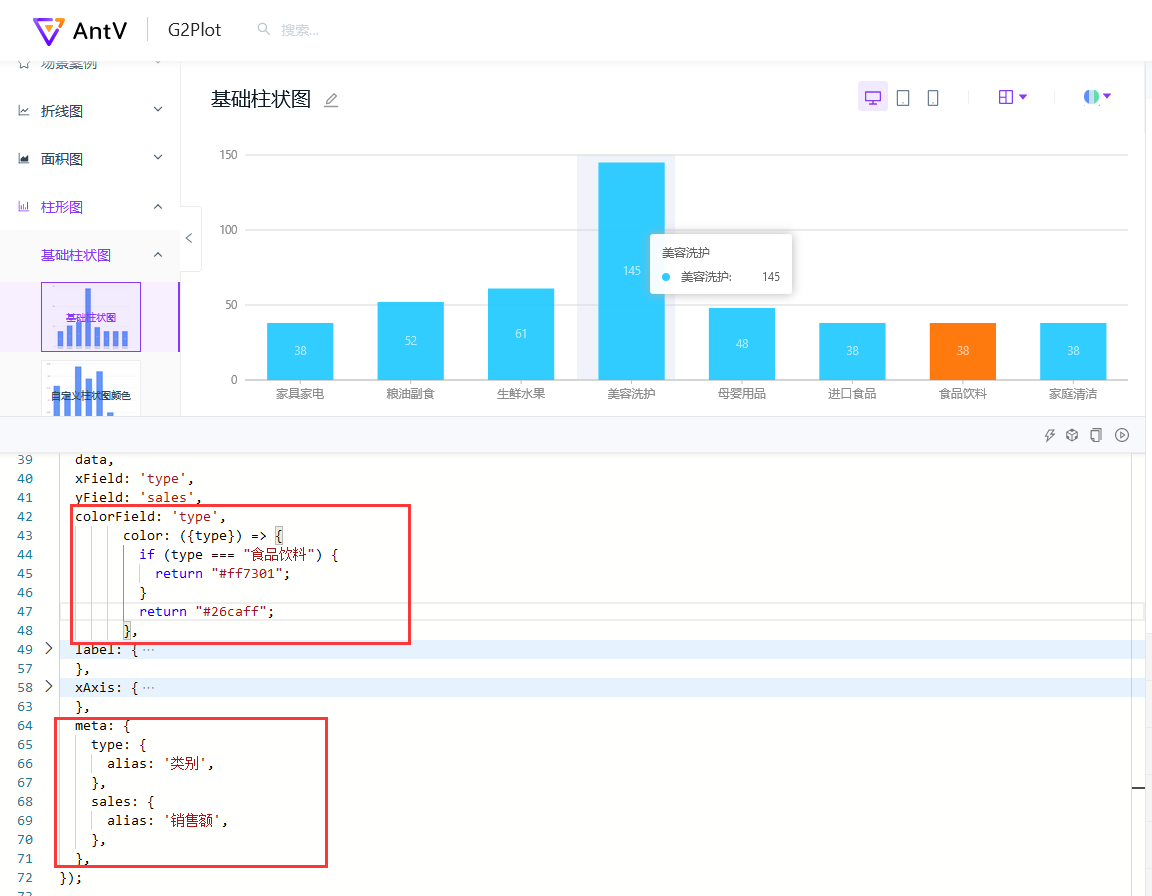
🐛 [BUG] 简单柱状图 同时设置 color(Function) 和 meta 后, meta 会失效
- Dominant language
- TypeScript
- Stars
- 2.7k
- Forks
- 591
- PR merge metrics
- No merged PRs in 30d
Description
### 🐛 Bug description [Please make everyone to understand it]
> Please provide a link by forking these links [G2Plot](https://codesandbox.io/s/g2plot-issue-template-gzfdq?file=/index.ts) or GitHub repo, a minimal reproduction.
* _Required_ **Link to minimal reproduction**:
### 📷 Step to reproduce
### 🏞 Expected result
### 🚑 Any additional [like screenshots]
* **G2Plot Version**: 2.4.15
* **Platform**:
Contributor guide
Research direction
The report concerns a simple bar chart in G2Plot 2.4.15, but provides no reproduction link, steps, expected result, file, or test path. Start by creating a minimal reproduction that sets color as a function together with meta, then trace the bar-chart configuration and add a regression test showing that meta remains effective when the bug is fixed.
Written by the indexing model from the issue text.
Assessment
- Tech stack
- typescript
- Domain
- data-visualization
- Issue type
- Bug
- Difficulty
- 4/5
- Estimated time
- 3-5 days
- Activity status
- Stale
- Clarity
- Needs clarification
- Newbie friendliness
- 25/100