🐛 [BUG] g2plot 2.x 柱状图设置 堆叠模式,y轴数据为类目型,x轴 为数值型,有些数据不显示,而且y轴显示有点问题
Open
Bug
- Dominant language
- TypeScript
- Stars
- 2.7k
- Forks
- 591
- PR merge metrics
- No merged PRs in 30d
Description
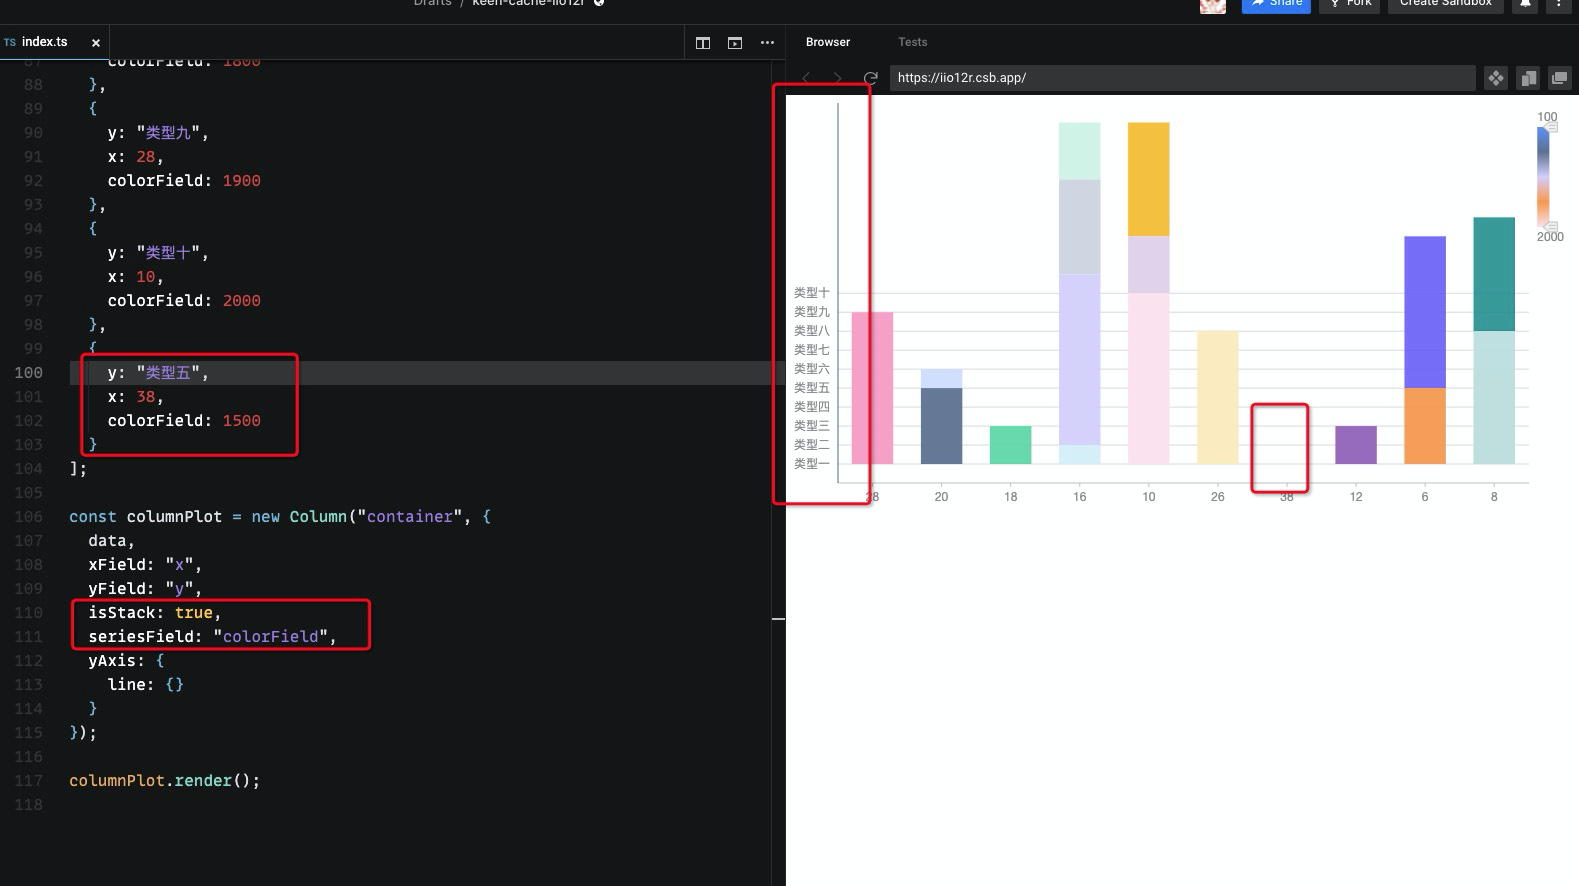
复现地址:https://codesandbox.io/s/keen-cache-iio12r?file=/index.ts
* **G2Plot Version**: v2.4.8
* **Platform**: g2plot
Contributor guide
Research direction
Start with the linked CodeSandbox reproduction at /index.ts using G2Plot v2.4.8, and inspect the stacked bar configuration with categorical y-axis data and numeric x-axis data. Reproduce the missing values and incorrect y-axis display, then confirm the chart renders all data and the y-axis correctly.
Written by the indexing model from the issue text.
Assessment
- Tech stack
- typescript
- Domain
- data-visualization
- Issue type
- Bug
- Difficulty
- 3/5
- Estimated time
- 1-2 days
- Activity status
- Stale
- Clarity
- Mostly clear
- Newbie friendliness
- 25/100