🐛 [BUG]双轴图-堆叠柱状折线图中,图tooltip的展示结果不符合预期
Open
Bug
- Dominant language
- TypeScript
- Stars
- 2.7k
- Forks
- 591
- PR merge metrics
- No merged PRs in 30d
Description
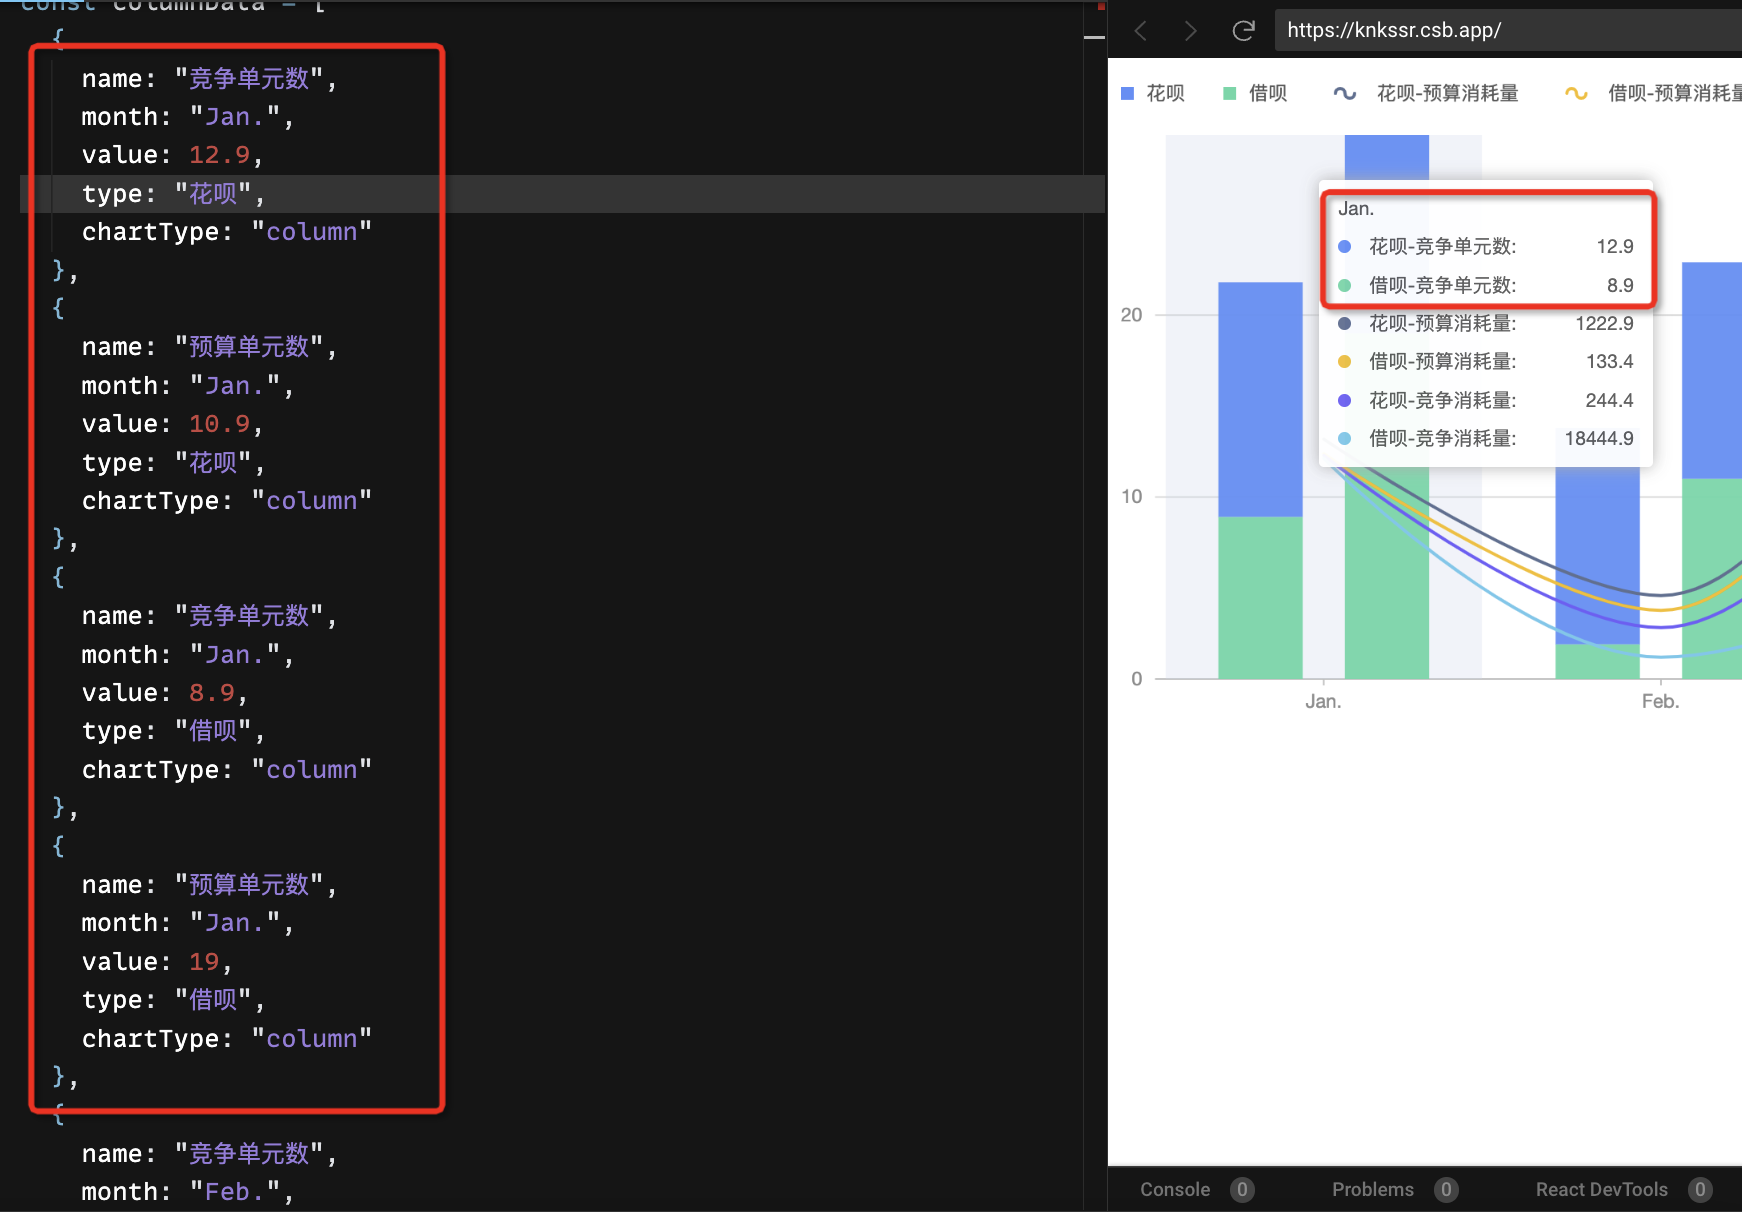
你好,双轴堆叠柱状折线图,给堆叠柱状图配置完后,设置tooltip的formatter的时候调试时发现,内容少了2条,预期column时tooltip中是会出现4条单元数相关的,现状是少执行了2次,只剩下2条
复现:https://codesandbox.io/s/upbeat-cori-knkssr
期望:在tooltip中堆叠柱状图展示的数据与数据条目匹配
* **G2Plot Version**:2.4.9
* **Platform**:g2plot
Contributor guide
Research direction
Start with the linked CodeSandbox reproduction using G2Plot 2.4.9 and inspect the tooltip formatter behavior for the dual-axis stacked column-and-line chart. Compare formatter calls and displayed entries with the expected four column-related data items; done means the tooltip data matches the chart entries.
Written by the indexing model from the issue text.
Assessment
- Tech stack
- typescript
- Domain
- data-visualization, frontend
- Issue type
- Bug
- Difficulty
- 3/5
- Estimated time
- 1-2 days
- Activity status
- Stale
- Clarity
- Mostly clear
- Newbie friendliness
- 35/100