🤔 缩略轴下双折线图的标签显示不全
- Dominant language
- TypeScript
- Stars
- 2.7k
- Forks
- 591
- PR merge metrics
- No merged PRs in 30d
Description
### 🐛 Question description [Please make everyone to understand it]
数据量比较大,标签初始化出来只能显示一部分,移动下缩略轴又能重新显示了,没用time轴因为用了以后右侧会有较大的空白
### 💻 Link to minimal reproduction
const line = new Line('container', {
data,
autoFit: true,
height: 400,
xField: 'time',
smooth:true,
label: {
},
padding:[40,20,60,40],
animation: false,
yField: 'value',
seriesField: 'category',
xAxis: {
},
yAxis: {
},
slider: {
start: 0.96,
end: 1,
},
point:{
style: {
fill: 'red',
lineWidth: 2,
},
}
});
line.render();
### 🏞 Expected result
希望初始化以后每个点都有标签
### 🚑 Any additional [like screenshots]
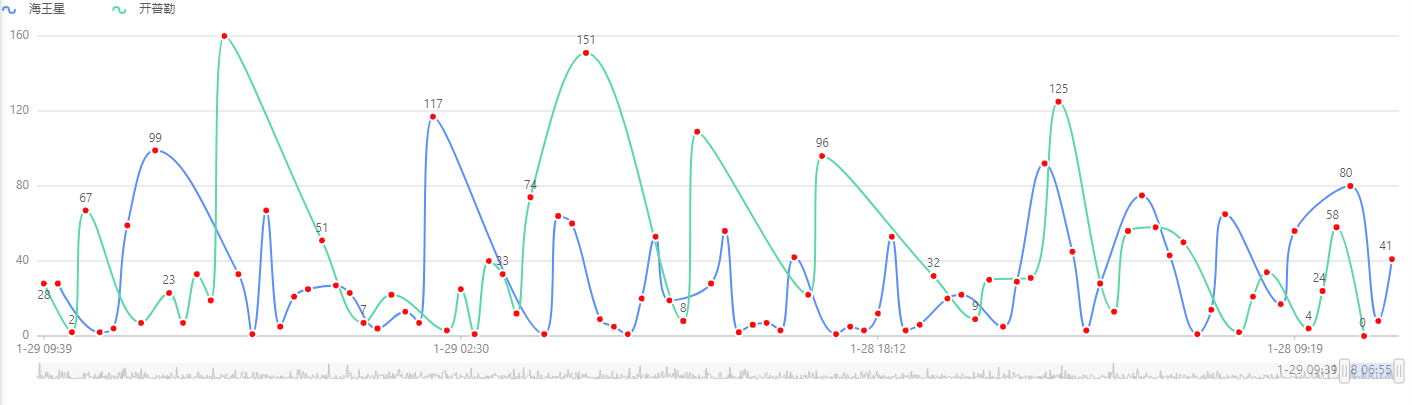
* **G2Plot Version**: "@antv/g2plot": "^2.4.8",
* **Platform**:vue
Contributor guide
Research direction
Start by running the supplied G2Plot Line configuration with the slider and large dataset, observing the initial label rendering before moving the thumbnail axis. Investigate the Line chart's label and slider behavior, then verify that every point has a visible label immediately after line.render() without requiring slider movement.
Written by the indexing model from the issue text.
Assessment
- Tech stack
- typescript
- Domain
- data-visualization
- Issue type
- Bug
- Difficulty
- 3/5
- Estimated time
- 1-2 days
- Activity status
- Stale
- Clarity
- Mostly clear
- Newbie friendliness
- 45/100