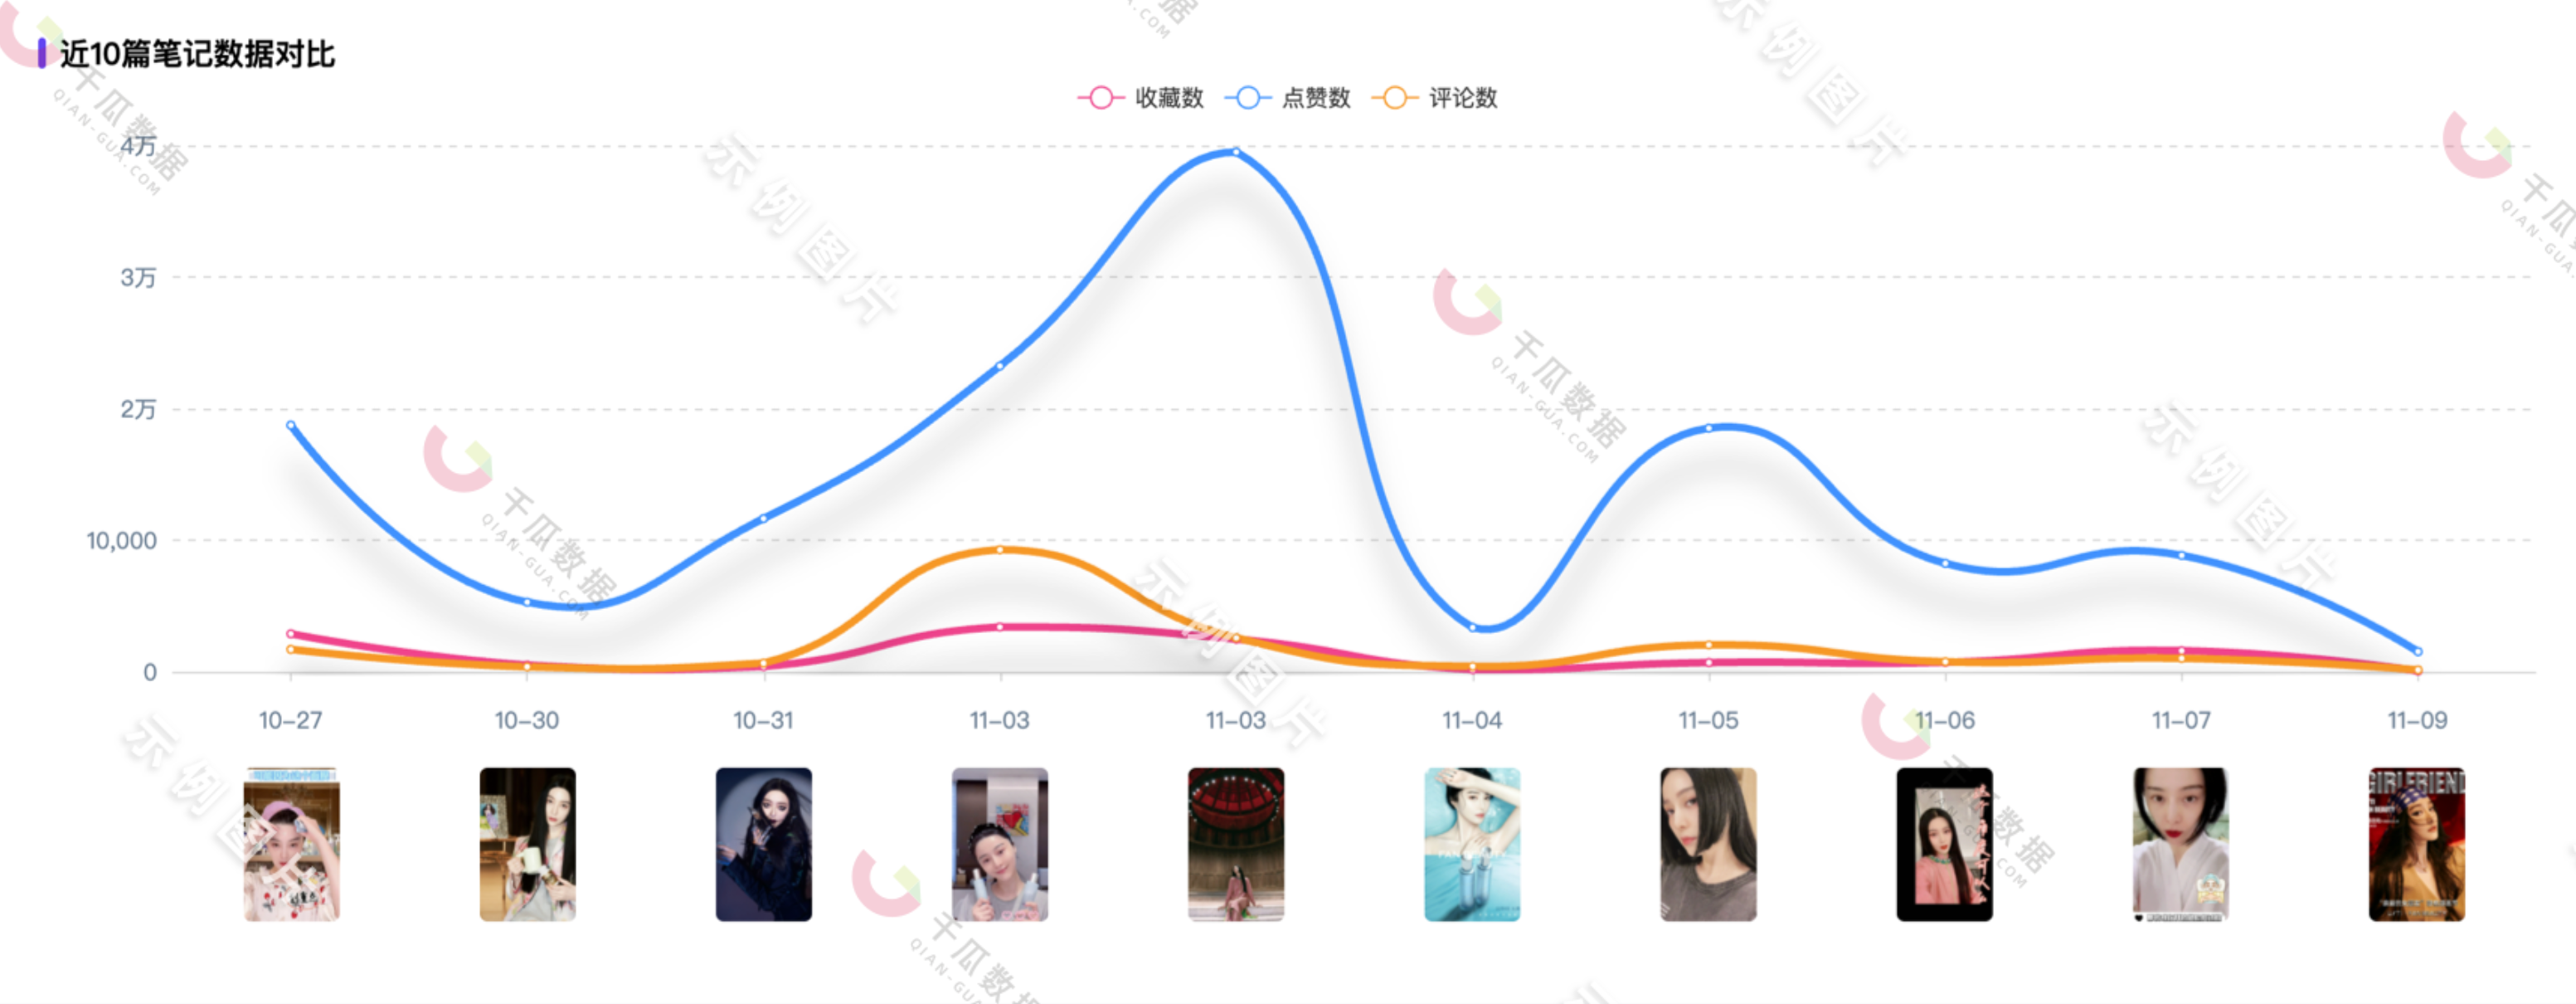
🤔 [QUESTION]如何使用html(文字+图片)自定义坐标轴的label
Open
Question
- Dominant language
- TypeScript
- Stars
- 2.7k
- Forks
- 591
- PR merge metrics
- No merged PRs in 30d
Description
如图
Contributor guide
Research direction
The issue provides only a screenshot and asks how to create custom axis labels with HTML text and images. No file, test, chart configuration, or entry point is supplied; clarify the chart setup and expected label behavior before identifying the relevant documentation or implementation area.
Written by the indexing model from the issue text.
Assessment
- Tech stack
- typescript
- Domain
- data-visualization
- Issue type
- Documentation
- Difficulty
- 1/5
- Estimated time
- Under an hour
- Activity status
- Stale
- Clarity
- Needs clarification
- Newbie friendliness
- 15/100