关于双轴的状态量
Open
Question
- Dominant language
- TypeScript
- Stars
- 2.7k
- Forks
- 591
- PR merge metrics
- No merged PRs in 30d
Description
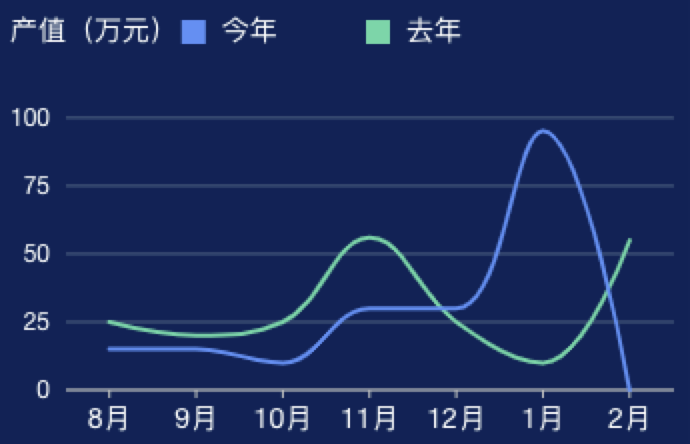
请问如何设置图中8月为active, setState中输出的是今年/明年的全部分组数据
Contributor guide
Research direction
Start with the attached dual-axis chart example and trace the setState call that produces grouped data for the current and following year. Determine how the August value is represented and whether the chart state is intended to expose only the active month or all groups. Done means the expected active August state and setState output are documented or reproduced with a confirmed fix.
Written by the indexing model from the issue text.
Assessment
- Tech stack
- typescript
- Domain
- data-visualization
- Issue type
- Bug
- Difficulty
- 4/5
- Estimated time
- 3-5 days
- Activity status
- Stale
- Clarity
- Needs clarification
- Newbie friendliness
- 20/100