🤔 [QUESTION] Ranged bar with slider?
- Dominant language
- TypeScript
- Stars
- 2.7k
- Forks
- 591
- PR merge metrics
- No merged PRs in 30d
Description
### 🐛 Question description [Please make everyone to understand it]
Adding slider to chart with ranged bars https://g2plot.antv.vision/en/examples/bar/range#basic depending on its value will manipulate the visibility of yField ( type in this case) as on the below
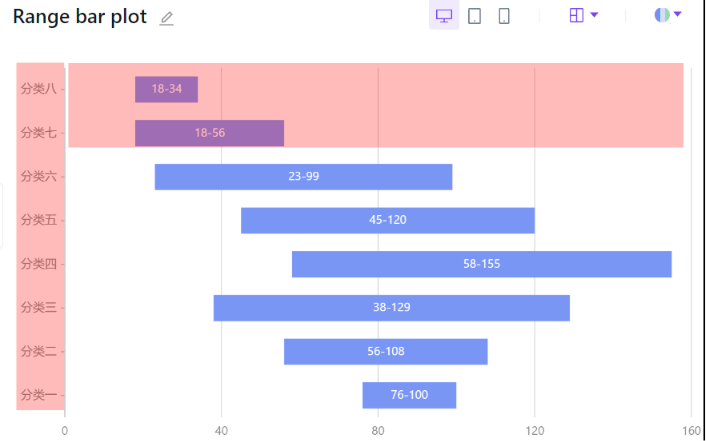
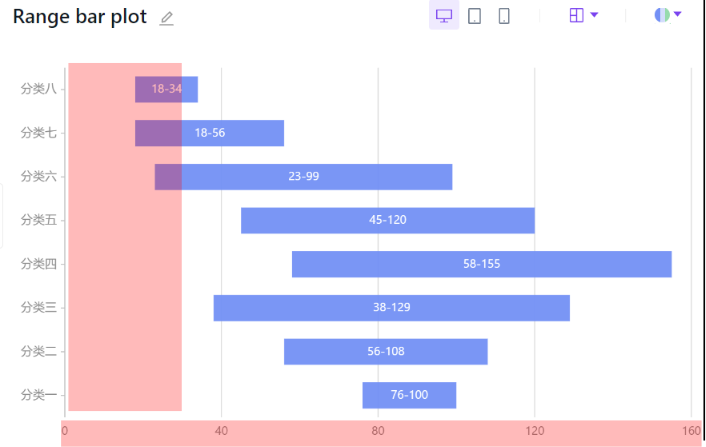
I'm trying to represent a timeline where each type will have multiple bars on xAxis. Is there a way to make the slider work on horizontal axis like below?
Contributor guide
Research direction
Start with the linked G2Plot ranged-bar example and compare its current slider behavior with the horizontal-axis timeline shown in the issue. Determine whether the requested yField visibility and horizontal slider behavior are supported; done means a clear answer or a defined implementation scope for that interaction.
Written by the indexing model from the issue text.
Assessment
- Tech stack
- typescript
- Domain
- data-visualization
- Issue type
- Feature
- Difficulty
- 5/5
- Estimated time
- Over a week
- Activity status
- Stale
- Clarity
- Needs clarification
- Newbie friendliness
- 15/100