请问区间条形图是否支持同一个坐标轴下多个区间数据🤔 [FEATURE]
- Dominant language
- TypeScript
- Stars
- 2.7k
- Forks
- 591
- PR merge metrics
- No merged PRs in 30d
Description
### 🐛 Question description [Please make everyone to understand it] ~FEATURE
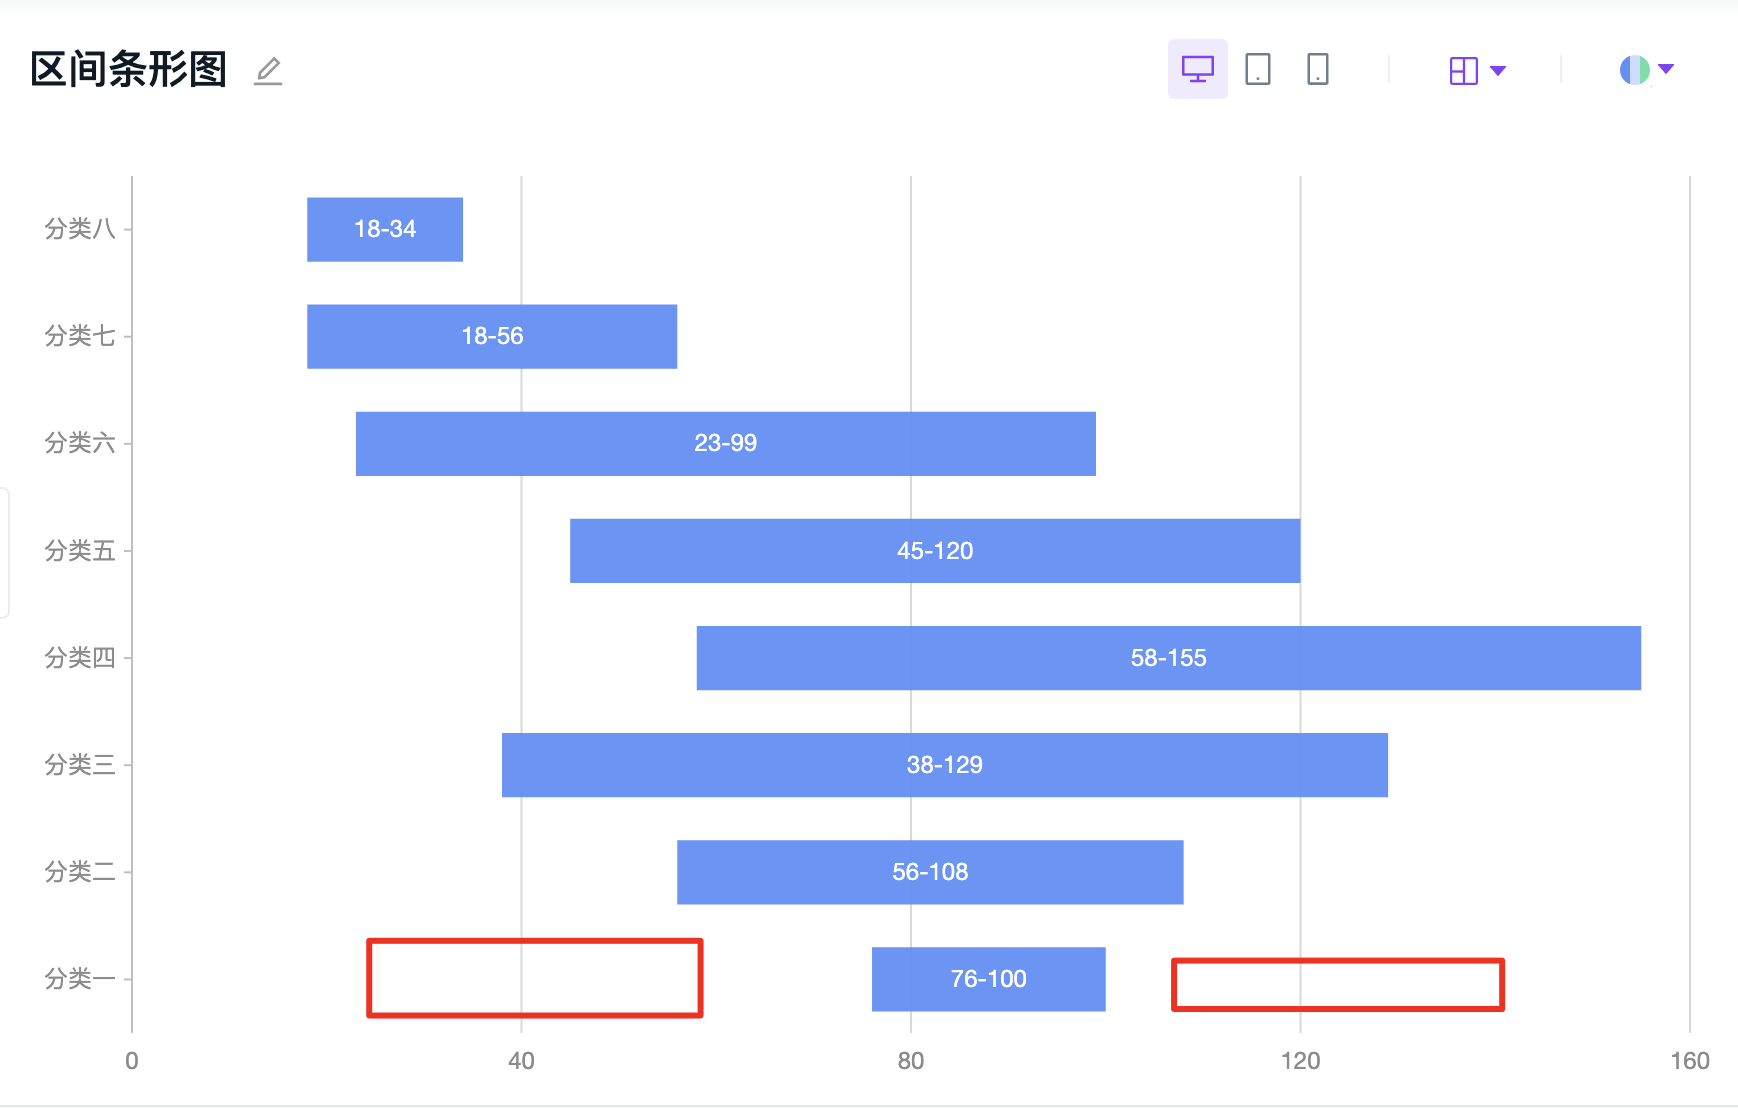
demo上的区间柱状图仅支持单一区间,不知道是否支持多个区间的能力?
如图所示,在某一坐标轴下,支持多个区间的数据展示,并且每个区间之间不连续。
例如下图:分类一有三个区间:[40,50],[76,100],[120,150],绘制在图表上的效果则是有三个条形
https://g2plot.antv.vision/zh/examples/bar/range#basic
### 🏞 Expected result
* **G2Plot Version**:
* **Platform**:
Contributor guide
Research direction
Start with the range bar example at https://g2plot.antv.vision/zh/examples/bar/range#basic and trace the related chart entry point and data configuration. Determine how multiple non-contiguous intervals for one category should be represented, then verify that the chart renders separate bars for intervals such as [40,50], [76,100], and [120,150].
Written by the indexing model from the issue text.
Assessment
- Tech stack
- typescript
- Domain
- data-visualization
- Issue type
- Feature
- Difficulty
- 5/5
- Estimated time
- Over a week
- Activity status
- Stale
- Clarity
- Mostly clear
- Newbie friendliness
- 35/100