缩略图滑动的问题
- Dominant language
- TypeScript
- Stars
- 2.7k
- Forks
- 591
- PR merge metrics
- No merged PRs in 30d
Description
### 🐛 带缩略图的问题
### 💻
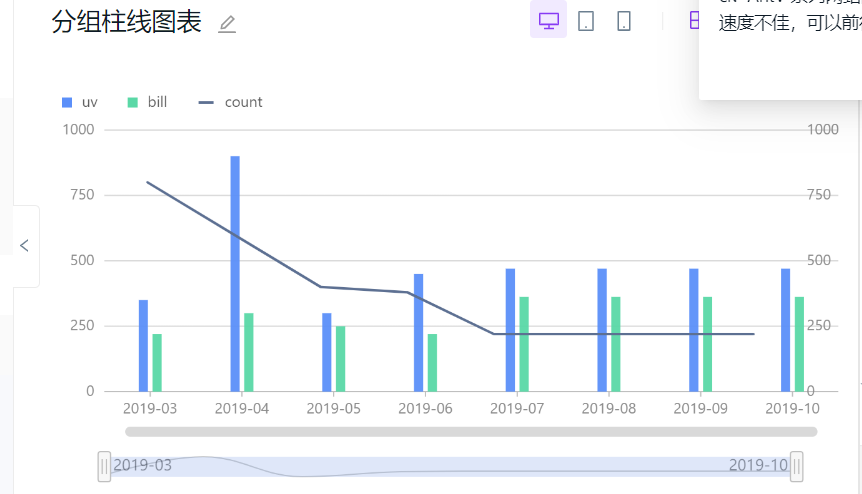
带缩略图的,使用下面的滑块时,折线会低于x轴,x轴的刻度变化有问题,而初始话时,折线是在x轴上方的,如下图:
### 🚑 Any additional 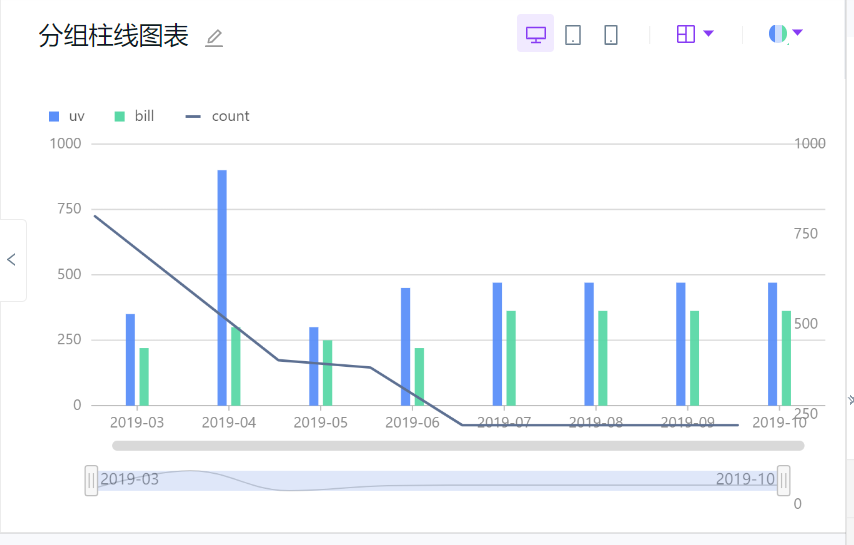
* **G2Plot Version**: 2.3.40
* **Platform**: web
Contributor guide
Research direction
Start by reproducing the thumbnail-slider behavior described for G2Plot 2.3.40 on the web, using the attached screenshots as the expected comparison. Trace the chart and thumbnail-slider entry points to find why the line crosses the x-axis and the x-axis tick labels change incorrectly; done means the initial and slider states both render correctly.
Written by the indexing model from the issue text.
Assessment
- Tech stack
- typescript
- Domain
- data-visualization
- Issue type
- Bug
- Difficulty
- 3/5
- Estimated time
- 1-2 days
- Activity status
- Stale
- Clarity
- Mostly clear
- Newbie friendliness
- 35/100