🐛 [BUG]双轴图 显示异常,把一个时间段的值显示在另一个时间段内
- Dominant language
- TypeScript
- Stars
- 2.7k
- Forks
- 591
- PR merge metrics
- No merged PRs in 30d
Description
### 🐛 Bug description
复现的链接
https://codesandbox.io/s/nifty-taussig-8rlpf?file=/src/App.tsx,
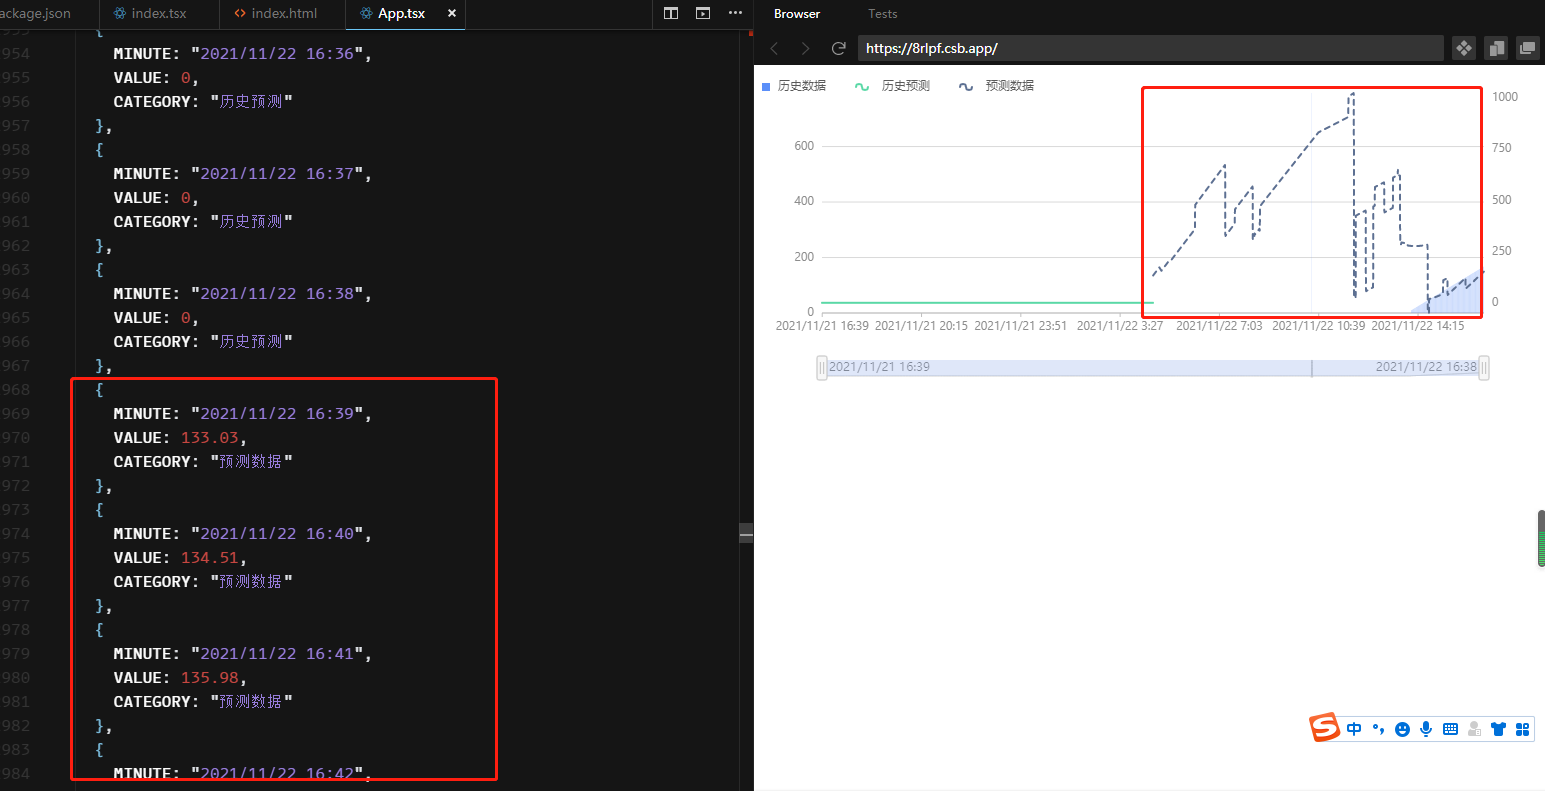
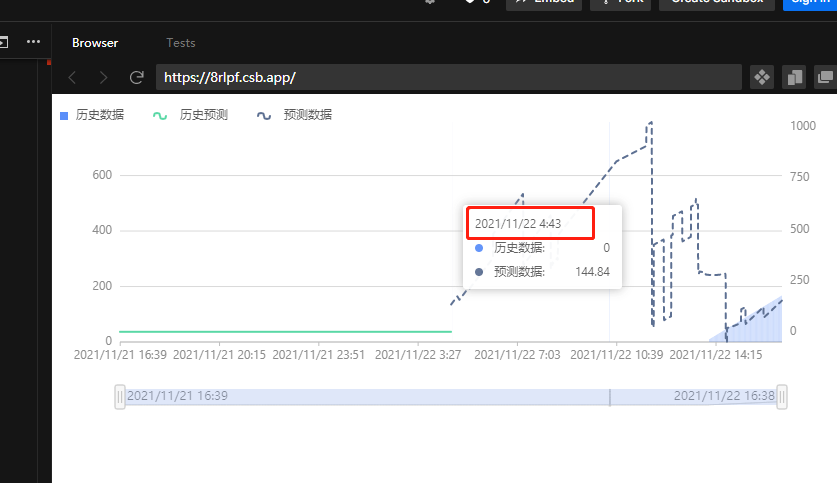
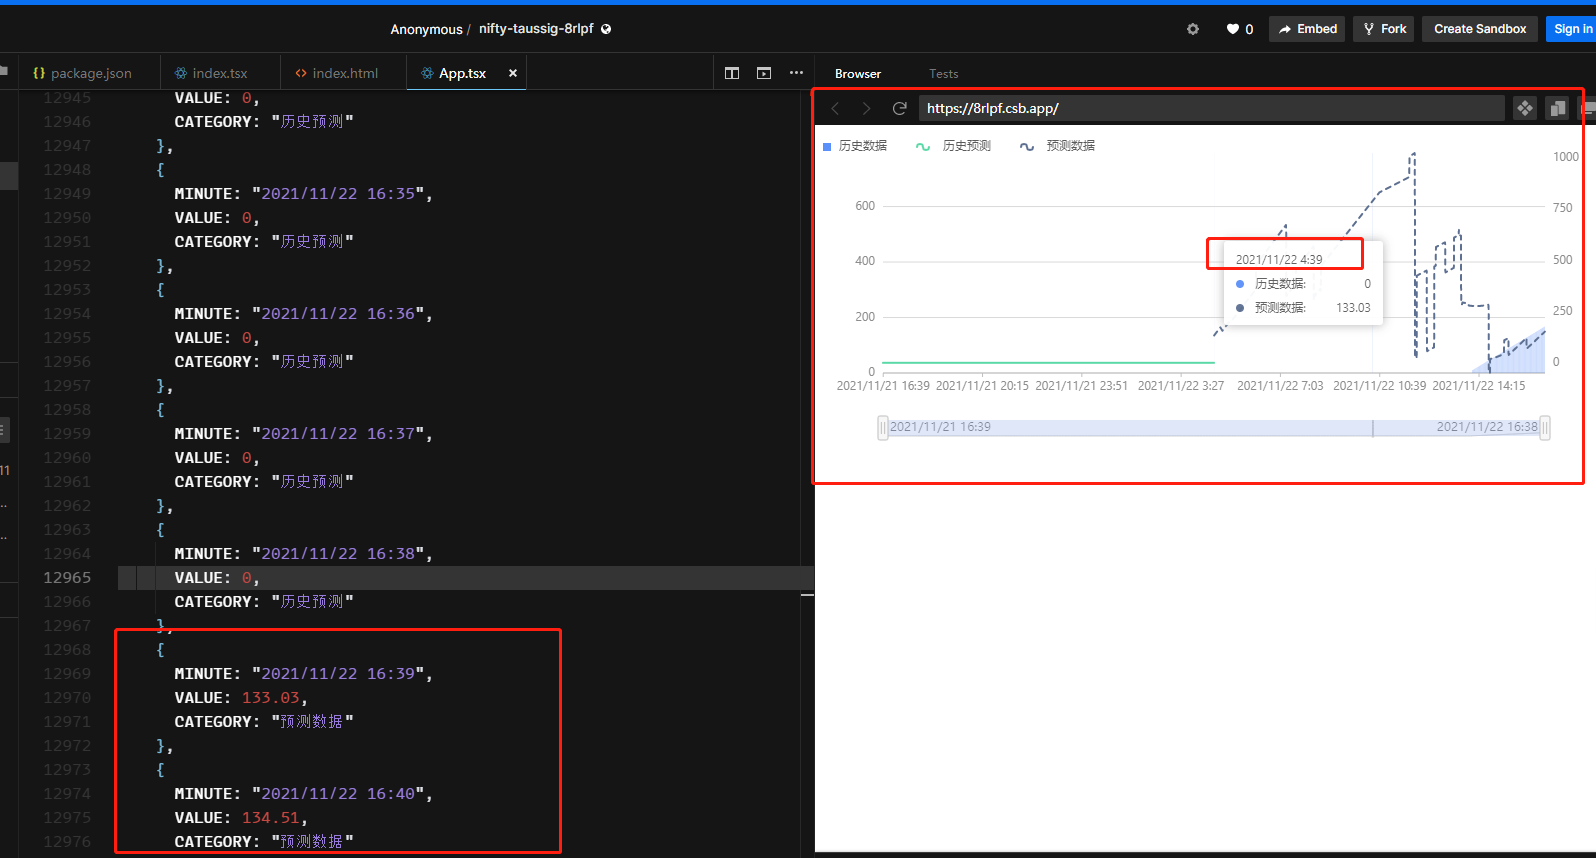
本身 虚线位置这段时间预测数据是不存在的 ,上面显示是从2021/11/22 4:39开始虚线的,但是 实际数据中是从2021/11/22 16:39才有的预测数据,为什么2021/11/22 16:39数据会在2021/11/22 4:39上显示呢,我们不是 24小时吗?难道没法区分是上午还是下午吗?是我配置问题还是?
### 🏞 希望尽快修复,否则就要换到ehcarts了,老板催得急o(* ̄︶ ̄*)o
### 🚑 Any additional [like screenshots]
* **G2Plot Version**: CodeSandbox用的 "@ant-design/charts": "1.2.11",项目中用的是@ant-design/charts": "1.2.14
* **Platform**: window10, antd-pro v5
Contributor guide
Research direction
Start with the linked CodeSandbox and inspect src/App.tsx, using the reported @ant-design/charts version as context. Reproduce the dual-axis chart with the supplied timestamps and compare the plotted forecast position with the source data. Done means the forecast beginning at 16:39 is shown at 16:39 rather than 04:39, with the 24-hour distinction preserved.
Written by the indexing model from the issue text.
Assessment
- Tech stack
- typescript
- Domain
- data-visualization
- Issue type
- Bug
- Difficulty
- 3/5
- Estimated time
- 1-2 days
- Activity status
- Stale
- Clarity
- Mostly clear
- Newbie friendliness
- 35/100