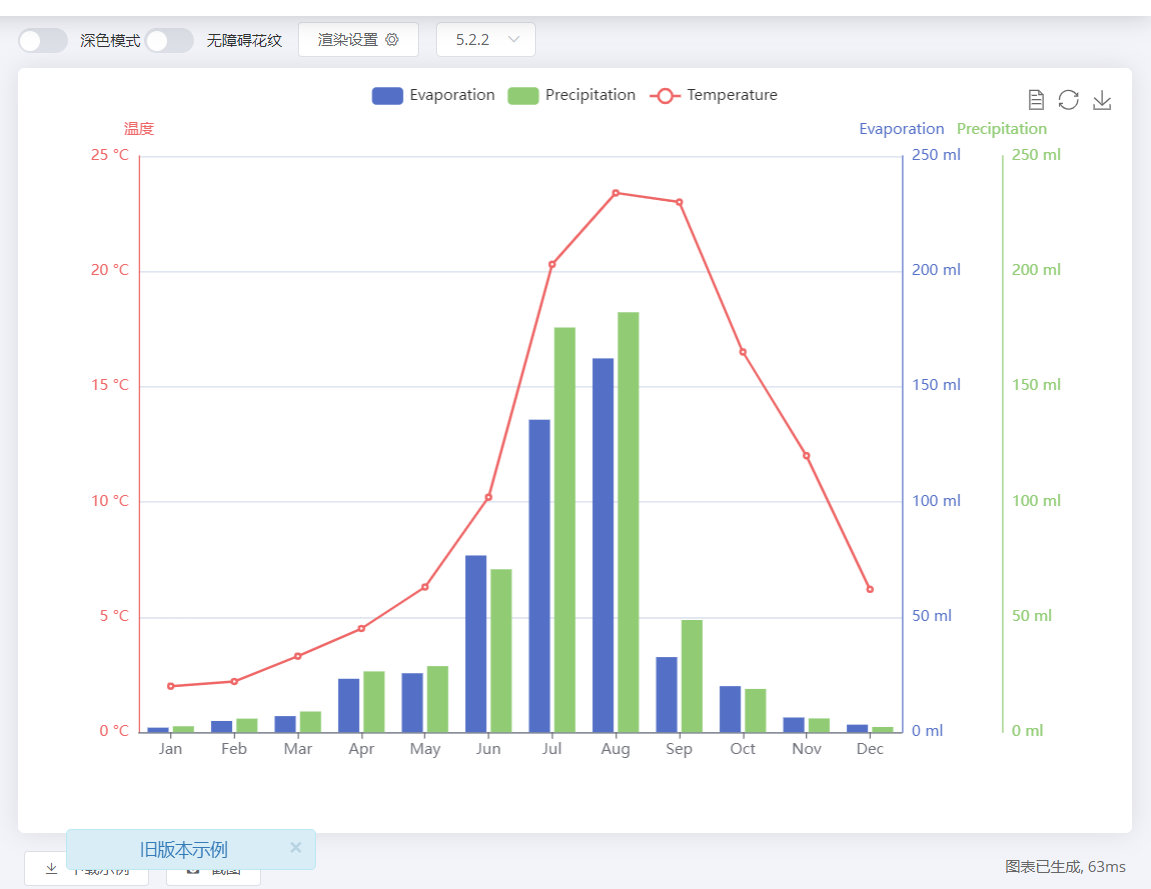
双轴图只可以配置两个 y 轴,需要有多个 y 轴的情况!
Open
Axis
feature
mix
- Dominant language
- TypeScript
- Stars
- 2.7k
- Forks
- 591
- PR merge metrics
- No merged PRs in 30d
Description
需要一个多轴图。
类似于下图这种
Contributor guide
Research direction
The issue mentions only the existing dual-axis chart and an example image; it names no files, tests, or entry points. Start by locating the dual-axis chart implementation and determine the requirements for supporting multiple y-axes from the example. Done means a chart can configure and render more than two y-axes.
Written by the indexing model from the issue text.
Assessment
- Tech stack
- typescript
- Domain
- data-visualization
- Issue type
- Feature
- Difficulty
- 5/5
- Estimated time
- Over a week
- Activity status
- Stale
- Clarity
- Needs clarification
- Newbie friendliness
- 20/100