🐛 [BUG] 当折线图 存在 color 回调 和 rawFields配置的时候, legend 影响 y轴伸缩的交互 将失效。
- Dominant language
- TypeScript
- Stars
- 2.7k
- Forks
- 591
- PR merge metrics
- No merged PRs in 30d
Description
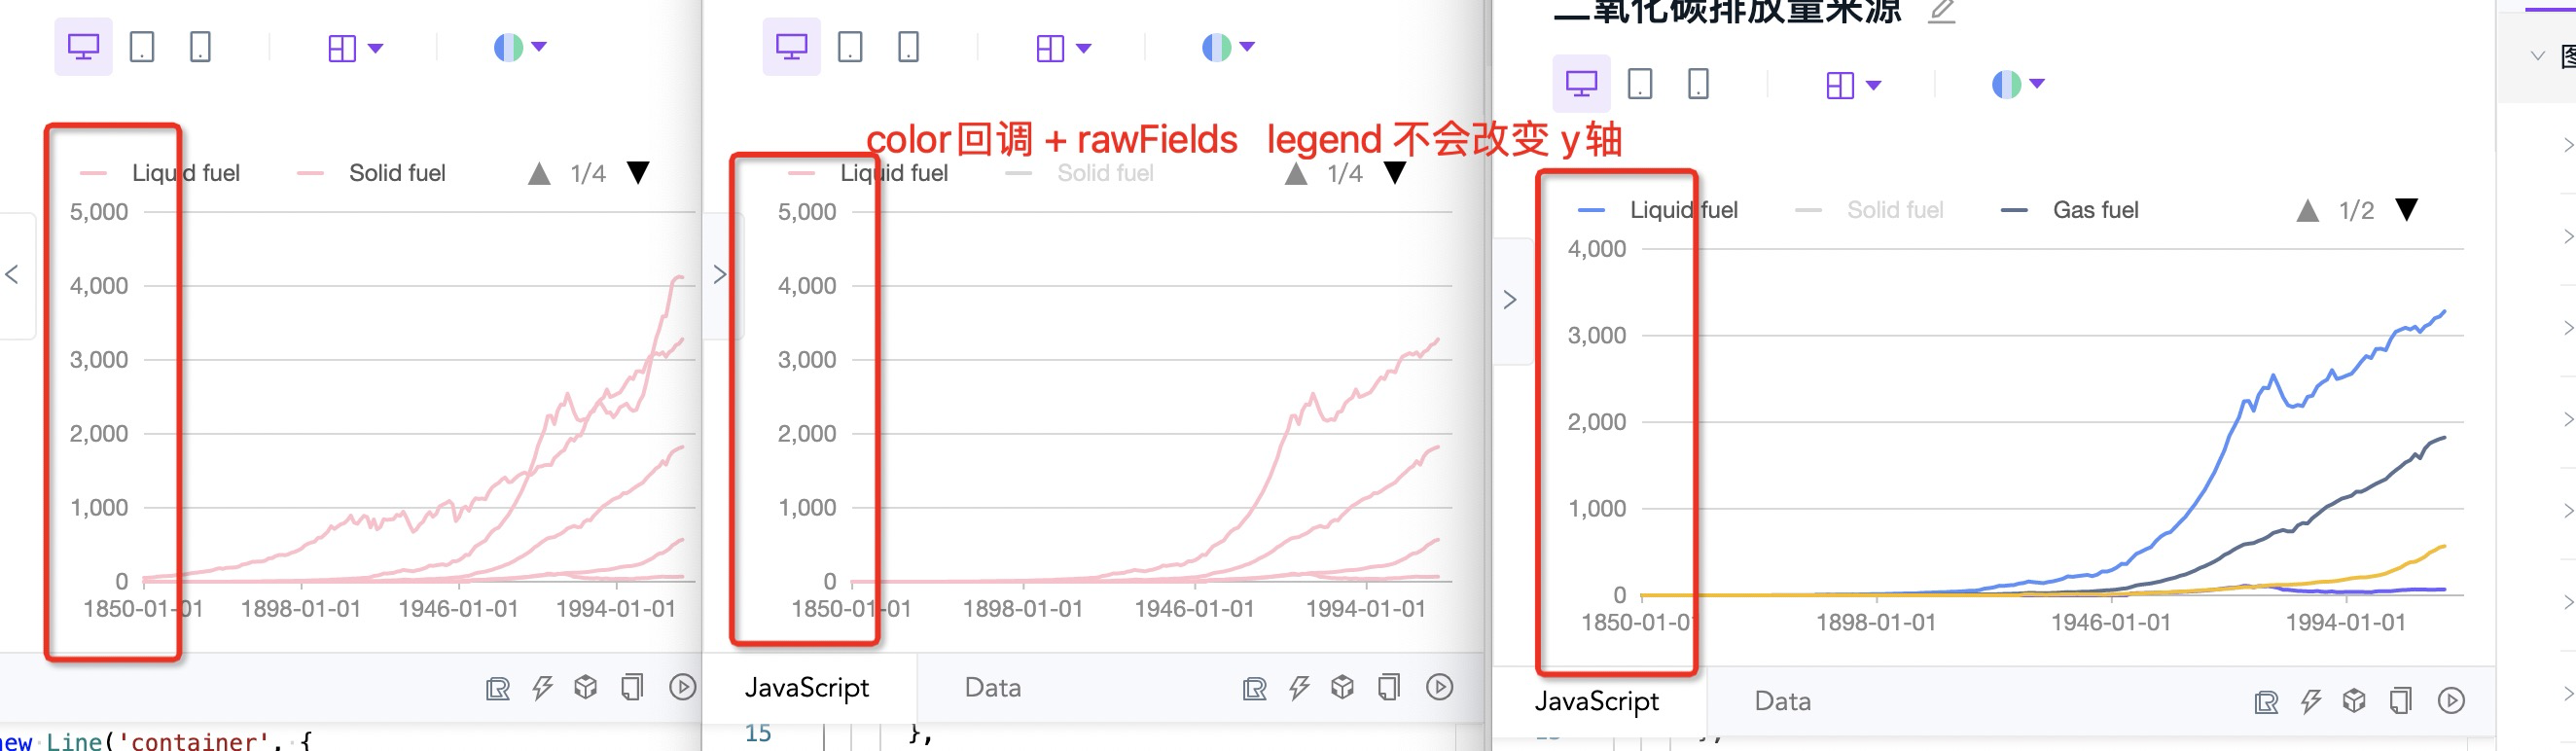
`配置`
`import { Line } from '@antv/g2plot';
fetch('https://gw.alipayobjects.com/os/bmw-prod/55424a73-7cb8-4f79-b60d-3ab627ac5698.json')
.then((res) => res.json())
.then((data) => {
const line = new Line('container', {
data,
xField: 'year',
yField: 'value',
seriesField: 'category',
color:()=>'pink',
rawFields:['value','category'],
});
line.render();
});
`
* **G2Plot Version*2.2.39*:
Contributor guide
Research direction
Start with the Line chart configuration in issue #2948 and reproduce it using the linked JSON data, color callback, and rawFields ['value','category']. Inspect the legend interaction and y-axis scaling behavior. Done means legend toggling still changes the y-axis extent with this configuration.
Written by the indexing model from the issue text.
Assessment
- Tech stack
- typescript
- Domain
- data-visualization
- Issue type
- Bug
- Difficulty
- 3/5
- Estimated time
- 1-2 days
- Activity status
- Stale
- Clarity
- Mostly clear
- Newbie friendliness
- 35/100