🥰 [FEATURE] 多维度(2)分组柱状图/条形图
- Dominant language
- TypeScript
- Stars
- 2.7k
- Forks
- 591
- PR merge metrics
- No merged PRs in 30d
Description
### 🥰 Features description [Please make everyone to understand it]
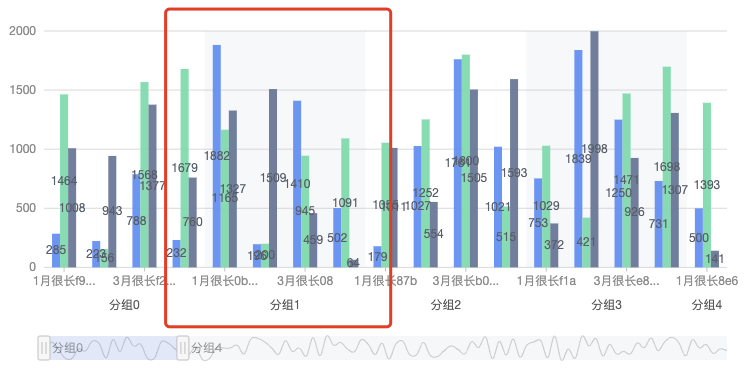
想要2个维度的 分组柱状图,我用分面facet大概实现了一个下面的效果(但是存在一些问题无法实现):
### 🏞 What problem does this feature solve
这个需求比较常见,比如一级维度为 省份, 二级维度为城市,想看某个省份下的各个城市的统计数据。
上面用自定义分面Facet逻辑实现的,坐标轴label自动旋转,因为是用分面逻辑拼合了多个view坐标轴实现,而坐标轴label旋转条件是 label个数大于2,导致 二级维度只有一个分组数据时,无法旋转,非常丑。
还有就是 分面拼合导致 坐标轴之间的数据重叠等问题 解决比较麻烦
想问问有没有比较好的解决方案 或者 想法
### 🧐 What does the proposed API look like
### 🚑 Any additional [like screenshots]
Contributor guide
Research direction
The issue names no files or tests; start by reviewing the existing custom facet approach and its axis-label rotation behavior. Use the province-and-city example and screenshot to define the proposed grouped bar or column API, with acceptance checks for single-subgroup labels and axis/data overlap.
Written by the indexing model from the issue text.
Assessment
- Tech stack
- typescript
- Domain
- data-visualization
- Issue type
- Feature
- Difficulty
- 5/5
- Estimated time
- Over a week
- Activity status
- Stale
- Clarity
- Needs clarification
- Newbie friendliness
- 25/100