🤔 [QUESTION] Color highlighted line chart annotations does not follow slider
- Dominant language
- TypeScript
- Stars
- 2.7k
- Forks
- 591
- PR merge metrics
- No merged PRs in 30d
Description
### 🐛 Question description [Please make everyone to understand it]
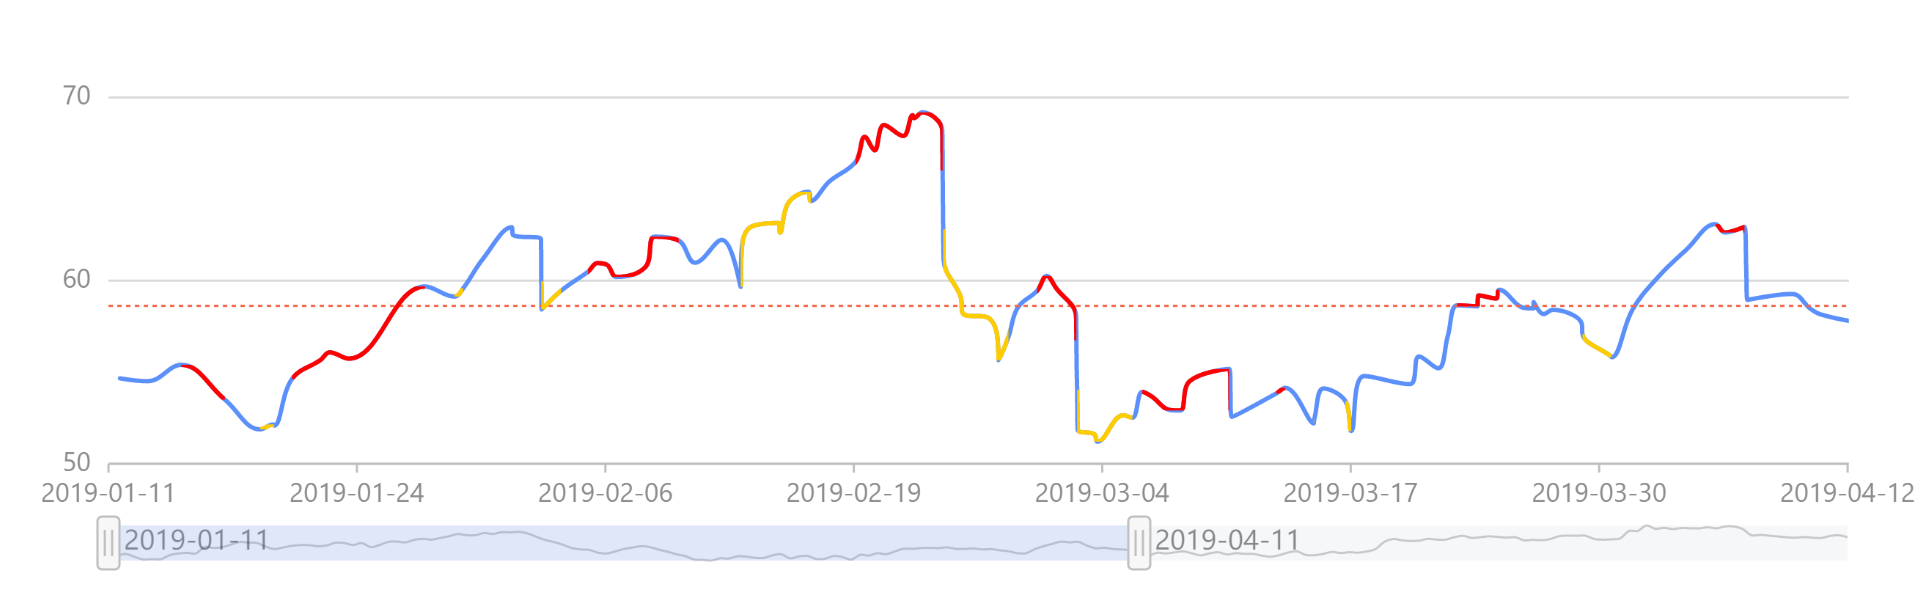
我想做一个用颜色高亮部分区域的折线图 (类似于chart.js里的[这个功能](https://www.chartjs.org/docs/latest/samples/line/segments.html)), 不加slider的时候没有任何问题, 但是加入以后, 发现拖拽时略有卡顿, 且高亮部分 (annotations) 没有完美随动
这张是没问题的
这张就偏离了
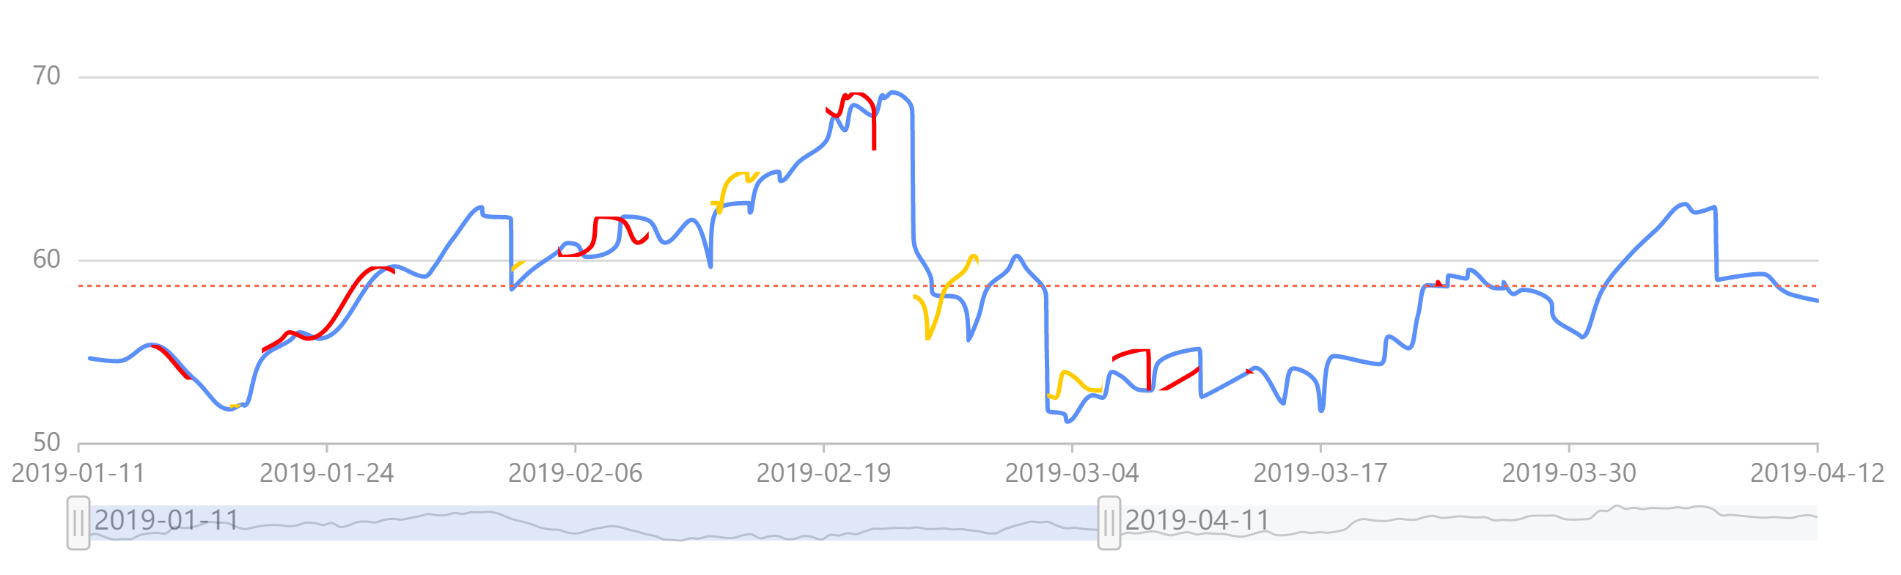
请问有什么办法解决?
### 💻 Link to minimal reproduction
Please provide a link by forking these links [g2plot](https://codesandbox.io/s/g2plot-reproduction-template-gyej1) or GitHub repo. What is a minimal reproduction, and why is it required?
### 🏞 Expected result
### 🚑 Any additional [like screenshots]
* **G2Plot Version**:
* **Platform**:
Contributor guide
Research direction
Start with the linked CodeSandbox minimal-reproduction template and compare the slider behavior with the referenced Chart.js line-segment example. The issue provides no project files, tests, version, platform, or expected result; done would require a reproducible case and a confirmed explanation or fix for the annotation lag and misalignment.
Written by the indexing model from the issue text.
Assessment
- Tech stack
- typescript
- Domain
- data-visualization
- Issue type
- Bug
- Difficulty
- 4/5
- Estimated time
- 3-5 days
- Activity status
- Stale
- Clarity
- Needs clarification
- Newbie friendliness
- 20/100