🐛 [BUG] 折线图缩略轴结合point(size自定义函数)后,会导致图表展示不全
- Dominant language
- TypeScript
- Stars
- 2.7k
- Forks
- 591
- PR merge metrics
- No merged PRs in 30d
Description
### 🐛 折线图缩略轴结合point(size自定义函数)后,会导致图表展示不全
### 💻 Link to minimal reproduction
Please provide a link by forking these links [g2plot](https://codesandbox.io/s/g2plot-reproduction-template-gyej1) or GitHub repo. What is a minimal reproduction, and why is it required?
### 📷 Step to reproduce
```js
import { Line } from '@antv/g2plot';
fetch('https://gw.alipayobjects.com/os/bmw-prod/1d565782-dde4-4bb6-8946-ea6a38ccf184.json')
.then((res) => res.json())
.then((data) => {
const line = new Line('container', {
data,
padding: 'auto',
xField: 'Date',
yField: 'scales',
xAxis: {
tickCount: 5,
},
slider: {
start: 0.5,
end: 1,
},
point: {
size: () => { return 5 },
shape: 'circle',
},
});
line.render();
});
```
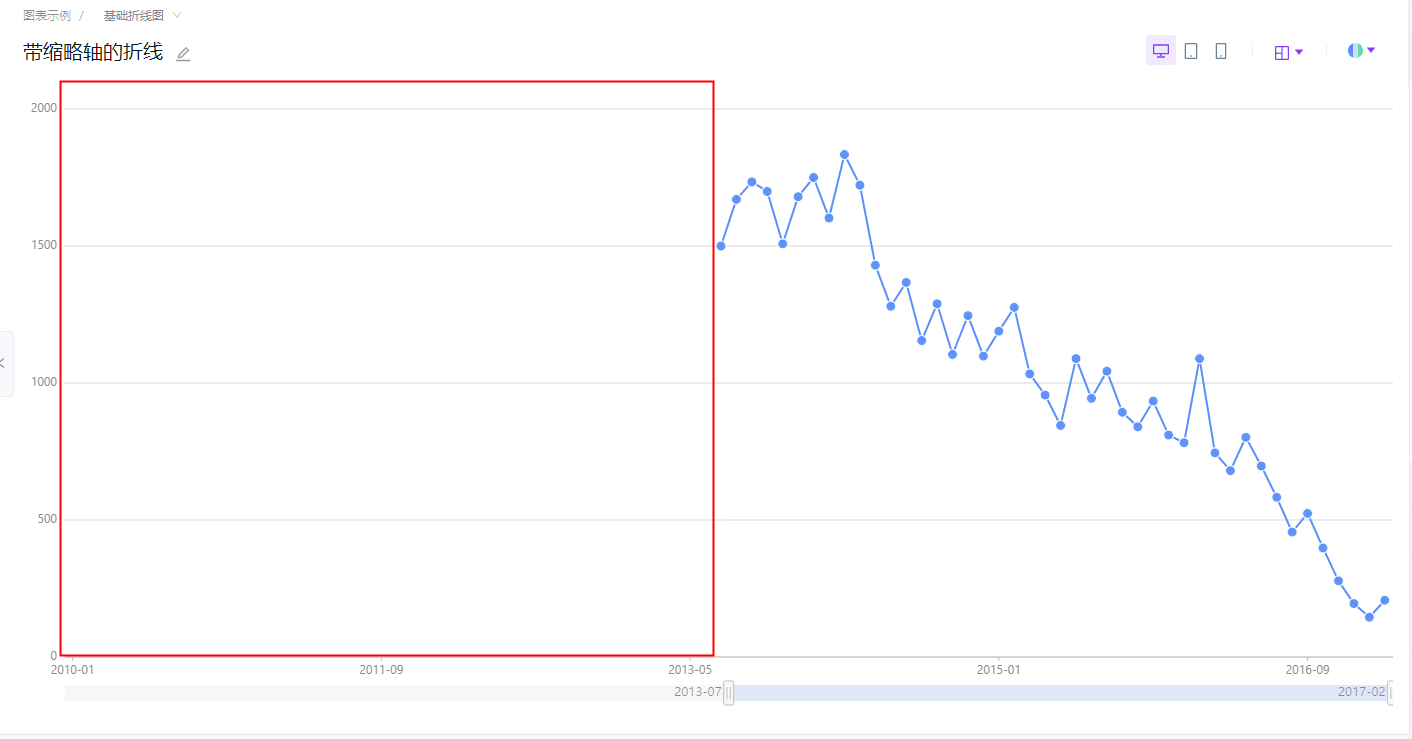
### 🏞 Expected result
### 🚑 Any additional [like screenshots]
* **G2Plot Version**: latest v2
* **Platform**: Windows 10
Contributor guide
Research direction
Start with the Line chart configuration in the reproduction, focusing on the interaction between slider and point.size as a function. Run the provided example with the linked data and compare the rendered chart with the expected full display; done means the chart is no longer cut off when both options are enabled.
Written by the indexing model from the issue text.
Assessment
- Tech stack
- typescript
- Domain
- data-visualization
- Issue type
- Bug
- Difficulty
- 3/5
- Estimated time
- 1-2 days
- Activity status
- Stale
- Clarity
- Mostly clear
- Newbie friendliness
- 35/100