🐛 [BUG] 双轴图 color 使用回调之后,tooltip 展示名不正确
- Dominant language
- TypeScript
- Stars
- 2.7k
- Forks
- 591
- PR merge metrics
- No merged PRs in 30d
Description
### 🐛 Bug description [Please make everyone to understand it]
### 💻 Link to minimal reproduction
Please provide a link by forking these links [g2plot](https://codesandbox.io/s/g2plot-reproduction-template-gyej1) or GitHub repo. What is a minimal reproduction, and why is it required?
### 📷 Step to reproduce
https://g2plot.antv.vison/en/examples/dual-axes/column-line#column-line
```ts
import { DualAxes } from '@antv/g2plot';
const data = [
{ time: '2019-03', value: 350, count: 800 },
{ time: '2019-04', value: 900, count: 600 },
{ time: '2019-05', value: 300, count: 400 },
{ time: '2019-06', value: 450, count: 380 },
{ time: '2019-07', value: 470, count: 220 },
];
const dualAxes = new DualAxes('container', {
data: [data, data],
xField: 'time',
yField: ['value', 'count'],
geometryOptions: [
{
geometry: 'column',
// seriesField: 'time',
color: () => 'red'
},
{
geometry: 'line',
// seriesField: 'time',
color: () => 'red',
lineStyle: {
lineWidth: 2,
},
},
],
});
dualAxes.render();
```
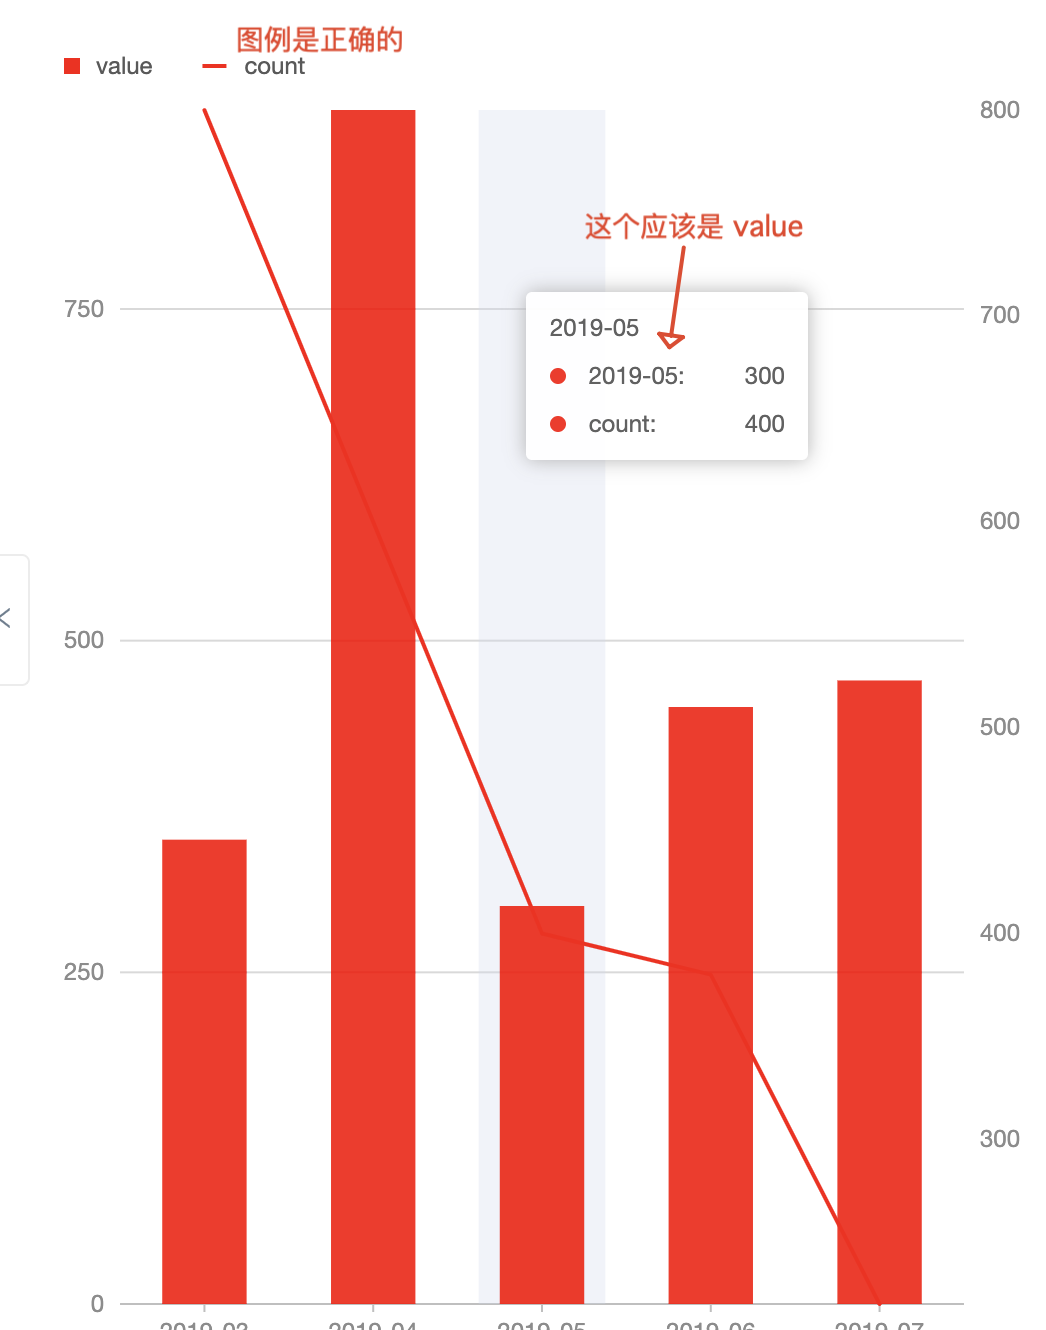
### 🏞 Expected result
### 🚑 Any additional [like screenshots]
* **G2Plot Version**:
* **Platform**:
Contributor guide
Research direction
Start with the dual-axes column-line reproduction in the issue and run the TypeScript example using callback-based colors on both geometries. Trace how tooltip display names are derived when no seriesField is set, then verify that the tooltip names are correct in the reproduction. No source file or test is identified in the issue.
Written by the indexing model from the issue text.
Assessment
- Tech stack
- typescript
- Domain
- data-visualization
- Issue type
- Bug
- Difficulty
- 3/5
- Estimated time
- 1-2 days
- Activity status
- Stale
- Clarity
- Needs clarification
- Newbie friendliness
- 25/100