🥰 [FEATURE] 跪求,区间柱状图label展示有其他的形式
- Dominant language
- TypeScript
- Stars
- 2.7k
- Forks
- 591
- PR merge metrics
- No merged PRs in 30d
Description
### 🥰 Features description [Please make everyone to understand it]
求解一个区间柱状图 label 配置相关问题哈~
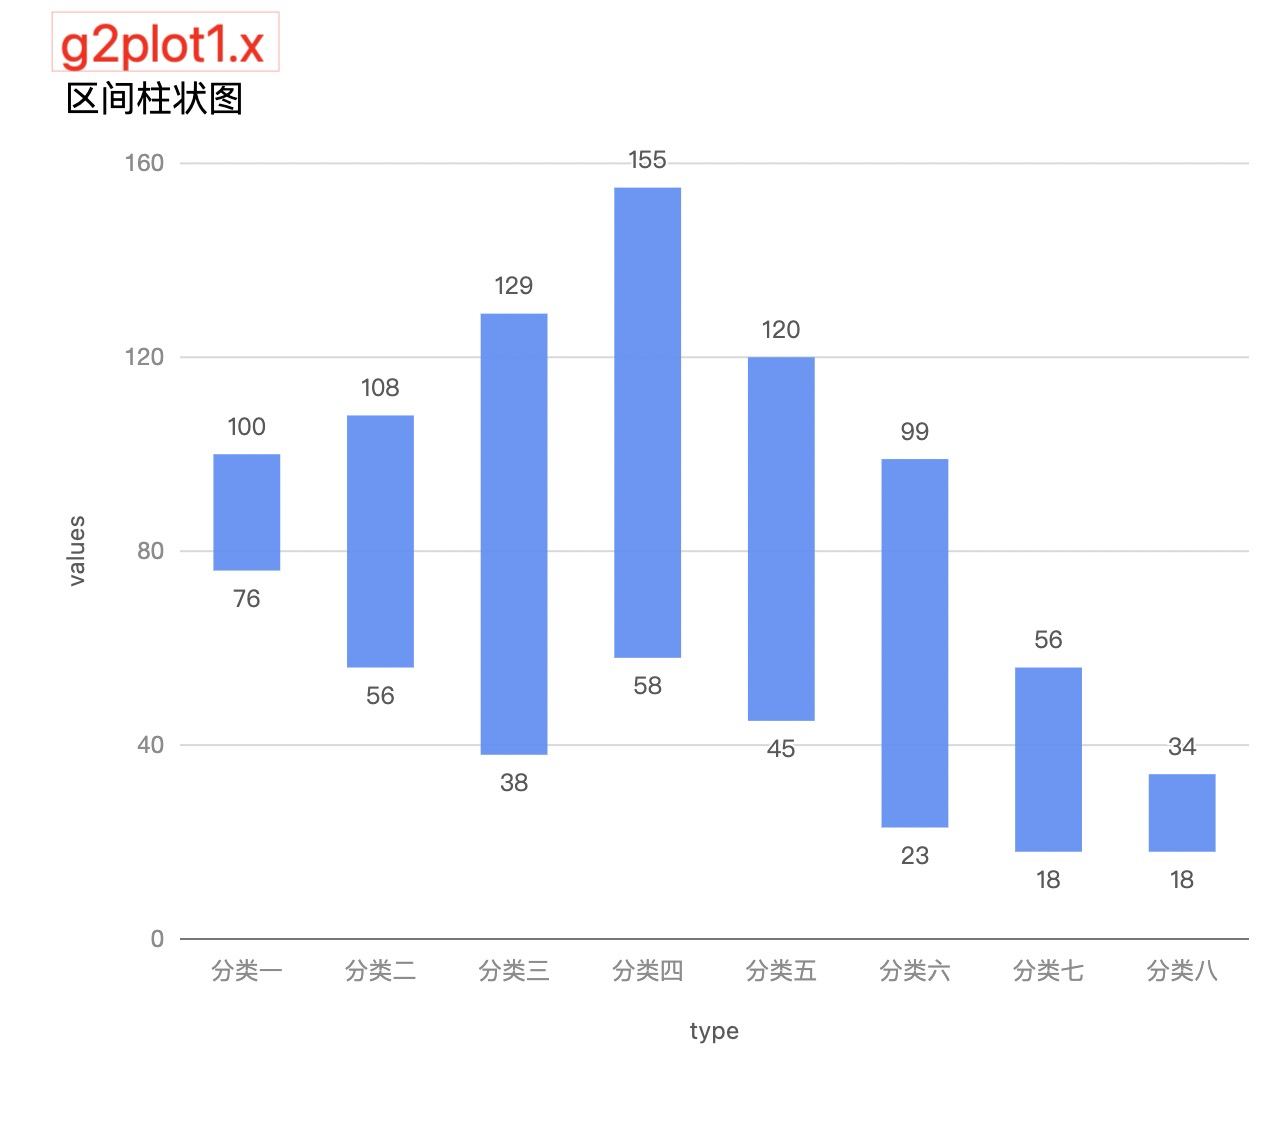
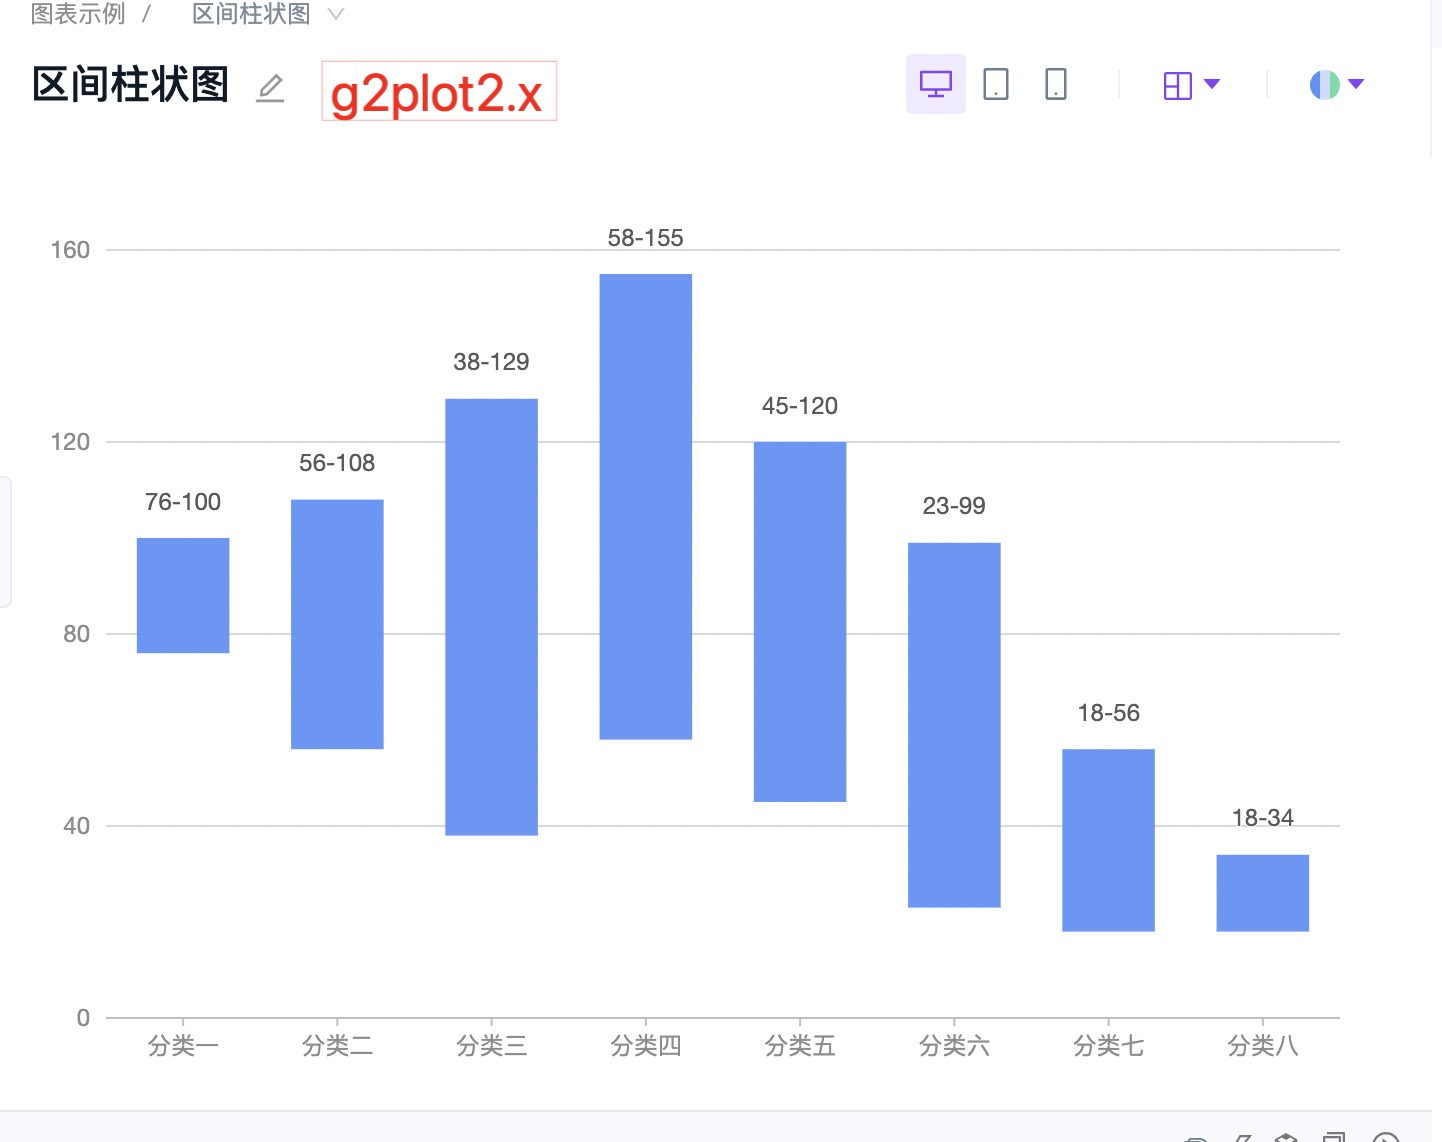
区间柱状图 g2plot1.x label属性中有,topStyle( 配置上侧 label 样式 )、bottomStyle( 配置下侧 label 样式 ) 这两个配置。
**g2plot2.x的区间柱状图,能不能也加个类似的配置进去呀!**
### 🏞 What problem does this feature solve
Contributor guide
Research direction
No files or tests are named. Start by locating the G2Plot 2.x interval bar chart label configuration and comparing it with the G2Plot 1.x topStyle and bottomStyle options. Done means the interval bar chart supports an equivalent way to configure the labels shown at its top and bottom, with coverage for the requested behavior.
Written by the indexing model from the issue text.
Assessment
- Tech stack
- typescript
- Domain
- data-visualization
- Issue type
- Feature
- Difficulty
- 4/5
- Estimated time
- 3-5 days
- Activity status
- Stale
- Clarity
- Mostly clear
- Newbie friendliness
- 45/100