🐛 [BUG] 双轴图的 scale 计算问题
- Dominant language
- TypeScript
- Stars
- 2.7k
- Forks
- 591
- PR merge metrics
- No merged PRs in 30d
Description
### 🐛 Bug description [Please make everyone to understand it]
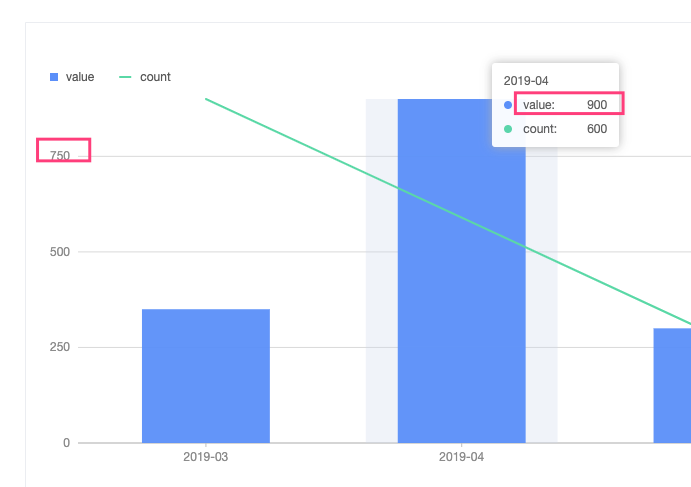
柱形图可以完美计算比例

但是双轴图,总会少计算一个
### 💻 Link to minimal reproduction
Please provide a link by forking these links [g2plot](https://codesandbox.io/s/g2plot-reproduction-template-gyej1) or GitHub repo. What is a minimal reproduction, and why is it required?
### 📷 Step to reproduce
### 🏞 Expected result
双轴图可以计算出 1000
### 🚑 Any additional [like screenshots]
* **G2Plot Version**:
* **Platform**:
Contributor guide
Research direction
Start by reproducing the reported dual-axis chart case and tracing its scale calculation, comparing it with the bar-chart behavior described in the issue. Done means the dual-axis chart calculates the expected value of 1000 and the regression is covered by an appropriate test.
Written by the indexing model from the issue text.
Assessment
- Tech stack
- typescript
- Domain
- data-visualization
- Issue type
- Bug
- Difficulty
- 4/5
- Estimated time
- 3-5 days
- Activity status
- Stale
- Clarity
- Needs clarification
- Newbie friendliness
- 25/100