🐛 [BUG] 折线图canvas模式折线下边沿的label不显示
- Dominant language
- TypeScript
- Stars
- 2.7k
- Forks
- 591
- PR merge metrics
- No merged PRs in 30d
Description
### 🐛 Bug description [Please make everyone to understand it]
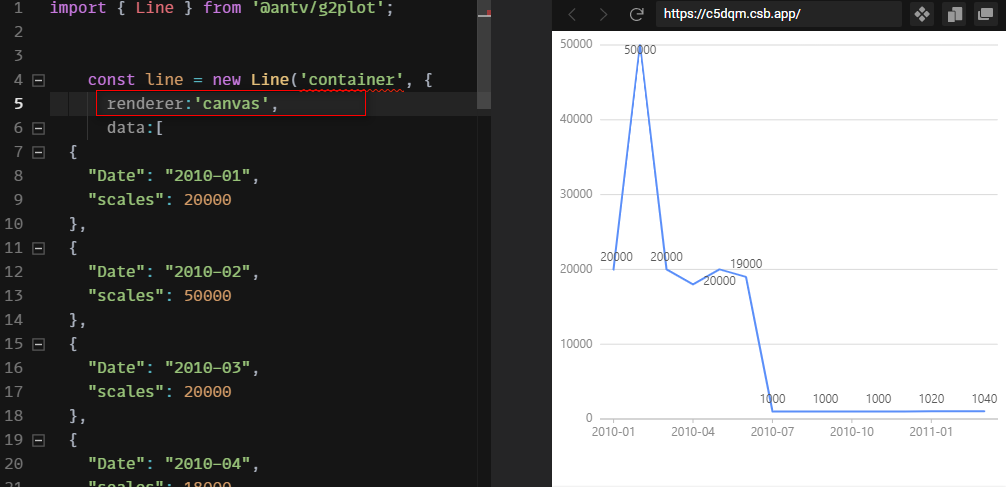
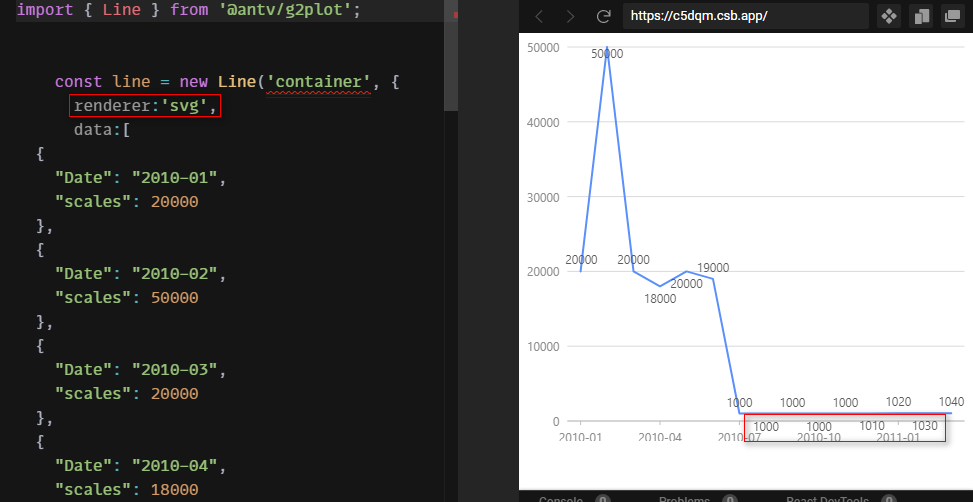
折线图canvas模式下线下label不显示,并且SVG和canvas下表现不一致(当图例的容器宽度比较小,label的文本多,部分label会往挤到下面,这个时候会触发)
canvas下
svg下( svg下展示了所有数据,我觉得这个因该是正确的)
### 💻 Link to minimal reproduction
https://codesandbox.io/s/stupefied-forest-c5dqm
### 📷 Step to reproduce
### 🏞 Expected result
应该和svg下表现一致
### 🚑 Any additional [like screenshots]
* **G2Plot Version**:
* **Platform**:
Contributor guide
Research direction
Start with the linked CodeSandbox reproduction and compare the line-chart label layout in canvas and SVG modes, especially when the legend container is narrow and labels wrap. Done means the canvas rendering displays the same lower-edge labels as SVG in that case.
Written by the indexing model from the issue text.
Assessment
- Tech stack
- typescript
- Domain
- data-visualization
- Issue type
- Bug
- Difficulty
- 3/5
- Estimated time
- 1-2 days
- Activity status
- Stale
- Clarity
- Mostly clear
- Newbie friendliness
- 35/100