🥰 [FEATURE] Implement data tables to complement plots
- Dominant language
- TypeScript
- Stars
- 2.7k
- Forks
- 591
- PR merge metrics
- No merged PRs in 30d
Description
### 🥰 Features description [Please make everyone to understand it]
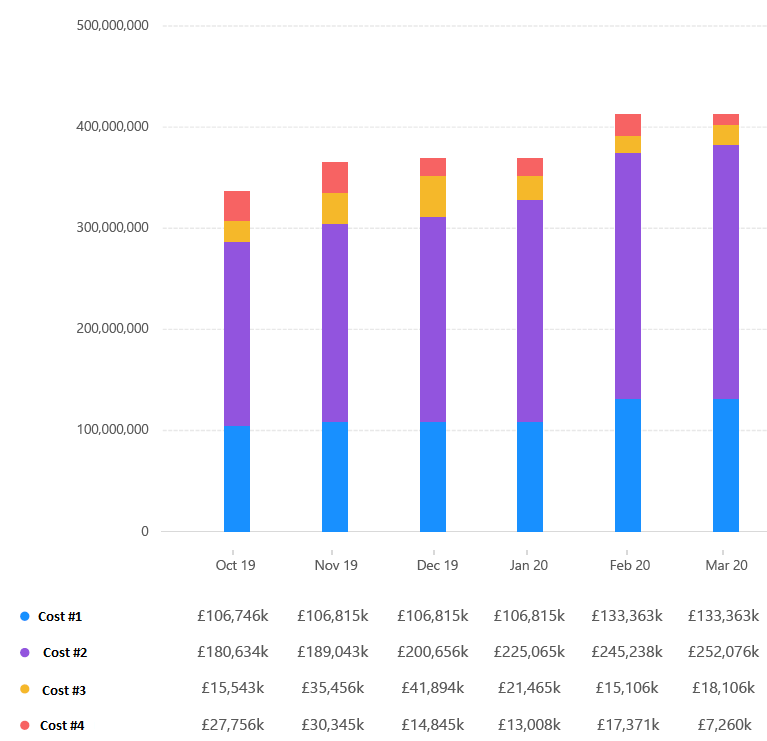
Implement the ability to render a table with data next to a plot (see screenshot below.) In addition, it would be great to be able to render not only data from the plot itself, but also other or derived data (in the example below, that may be another line for "Total costs" which shows the sum of all data).
### 🏞 What problem does this feature solve
For situations with many data points, a table lays out all the information more clearly. The user does NOT need to go through all the tooltips to see the various amounts. Furthermore, it would allow the calculation of derived data, such as ratios and more, which could be extremely relevant to show to the user.
Why not render a table separately to `g2plot`? Well the `g2plot` internals can make sure that such a table is in sync with the plot, in terms of the data but also any heights/widths that must align with the axes. Currently, if done by using ant-design `Table` component, the table column widths would be extremely difficult to calculate.
### 🧐 What does the proposed API look like
Note that I'm not that well-versed with the capabilities of G2, so the below are just some of my random thoughts.
Theoretically, this can be implemented as a new `table` plot that can then be rendered using `Mix` or `Facet`. However, that will constrain the type of plots that can have an adjacent `table`. For example, the `Bullet` plot is not supported by `Mix`.
Another better solution is to allow the legend to be laid out as a table that can show data points synchronized with the "closest" axis of the respective plot. This will also allow the ability to more easily render the colors of the various data series.
### 🚑 Any additional [like screenshots]
Contributor guide
Research direction
Start by reviewing the existing Mix, Facet, Bullet, and legend/layout entry points in G2Plot, then compare how an adjacent table could stay synchronized with plot data and axis dimensions. Clarify the API and rendering scope before implementation; done should include aligned table output, support for plot or derived data, and coverage across the intended plot types.
Written by the indexing model from the issue text.
Assessment
- Tech stack
- typescript
- Domain
- data-visualization
- Issue type
- Feature
- Difficulty
- 5/5
- Estimated time
- Over a week
- Activity status
- Stale
- Clarity
- Needs clarification
- Newbie friendliness
- 25/100