"基本折线图": rawFields 传入多个数据字段,影响了color回调中的数据分组、导致图形映射也有些问题。
- Dominant language
- TypeScript
- Stars
- 2.7k
- Forks
- 591
- PR merge metrics
- No merged PRs in 30d
Description
* **G2Plot Version**: v2.3.17
* **Platform**: macOS 11.3.1
* **Mini Showcase(like screenshots)**:
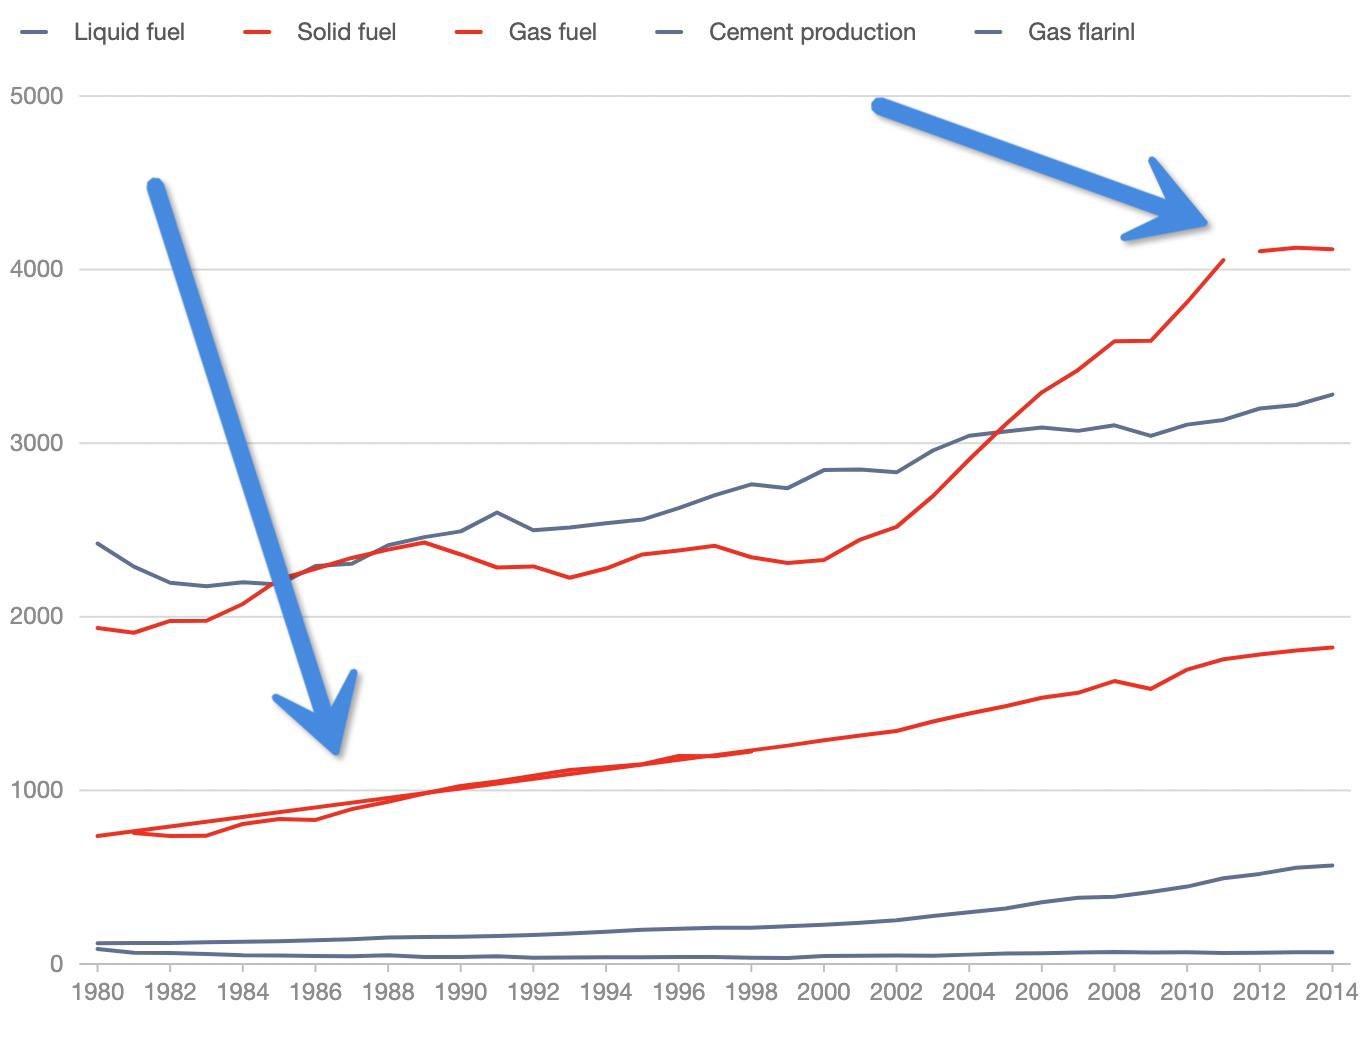
* **CodePen Link**: https://codesandbox.io/s/stupefied-haze-vp7g0?file=/index.js:18840-18879
使用 rawFields 字段是为了,在支持Function的配置上,拿到当前所对应的数据,不然默认只有一条seriesField对应的数据。
Contributor guide
Research direction
Start with the CodeSandbox reproduction linked in the issue, especially index.js around lines 18840-18879, and inspect how rawFields reaches the color callback. Compare the grouping and visual mapping when rawFields contains multiple data fields. Done means the callback receives the intended grouped data and the chart mapping no longer shows the reported problem.
Written by the indexing model from the issue text.
Assessment
- Tech stack
- typescript
- Domain
- data-visualization
- Issue type
- Bug
- Difficulty
- 4/5
- Estimated time
- 3-5 days
- Activity status
- Stale
- Clarity
- Mostly clear
- Newbie friendliness
- 28/100