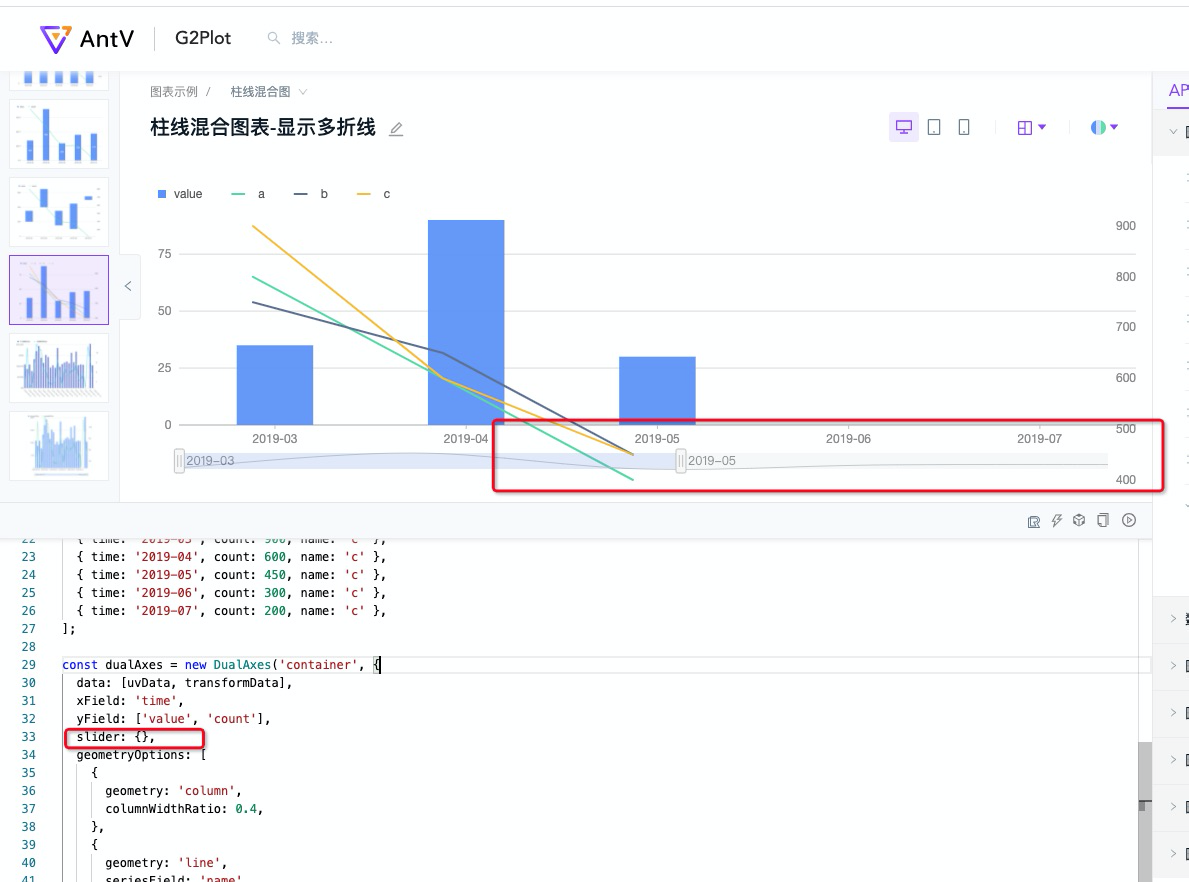
折线柱状图 缩略轴 拖动时,折线运动到 x轴下方了
Open
- Dominant language
- TypeScript
- Stars
- 2.7k
- Forks
- 591
- PR merge metrics
- No merged PRs in 30d
Description
* **G2Plot Version**: 2.3.17
* **Platform**: g2plot 2.x
* **Mini Showcase(like screenshots)**:
* **CodePen Link**:
复现:https://codesandbox.io/s/shy-waterfall-iqisv?file=/index.ts
Contributor guide
Research direction
Start with the reproduction at CodeSandbox, using /index.ts and G2Plot 2.3.17. Drag the line chart's thumbnail axis to confirm when the line moves below the x-axis, then trace the chart behavior involved in that interaction. Done means the line remains correctly positioned above the x-axis while the thumbnail axis is dragged.
Written by the indexing model from the issue text.
Assessment
- Tech stack
- typescript
- Domain
- data-visualization
- Issue type
- Bug
- Difficulty
- 3/5
- Estimated time
- 1-2 days
- Activity status
- Stale
- Clarity
- Mostly clear
- Newbie friendliness
- 45/100