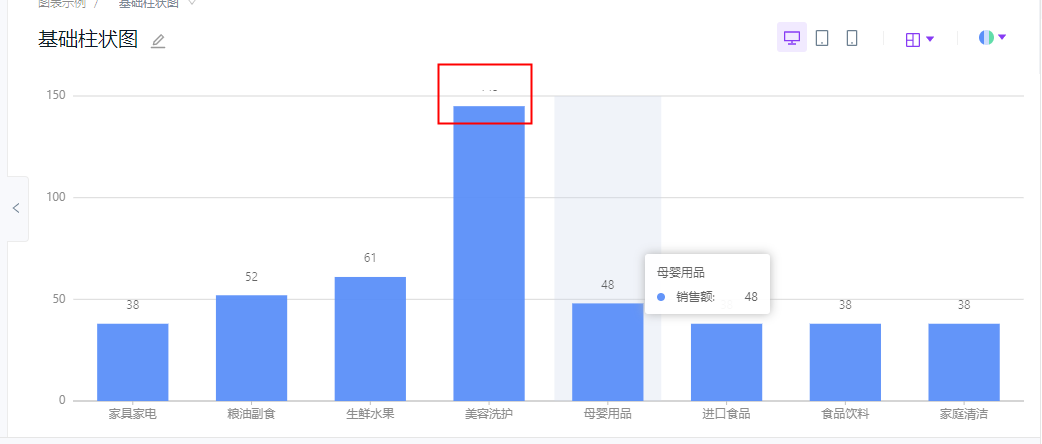
图表label 可以 参与 图表的宽高自适应。数据太长或太短都可以全部显示。
Open
Label
- Dominant language
- TypeScript
- Stars
- 2.7k
- Forks
- 591
- PR merge metrics
- No merged PRs in 30d
Description
* **G2Plot Version**:
* **Platform**:
* **Mini Showcase(like screenshots)**:
* **CodePen Link**:
- 希望图表的 label 可以参与图表的宽高自适应。数据老是缺少部分, apdding太死了,自己算也太麻烦,还不一定对。
Contributor guide
Research direction
No source file, chart type, or test is named in the issue. Start by locating the chart layout and label sizing entry points in G2Plot, then reproduce the reported truncation with long and short labels. Done means the chart dimensions adapt so labels are fully displayed without requiring manual padding.
Written by the indexing model from the issue text.
Assessment
- Tech stack
- typescript
- Domain
- data-visualization
- Issue type
- Feature
- Difficulty
- 4/5
- Estimated time
- 3-5 days
- Activity status
- Stale
- Clarity
- Needs clarification
- Newbie friendliness
- 35/100